Advertisements
Advertisements
प्रश्न
Construct a demand schedule showing relationship between price and quantity demanded.
Advertisements
उत्तर
Hypothetical Individual Demand Schedule
| Price (in ₹) | Quantity demanded (in units) |
| 5 | 1 |
| 4 | 2 |
| 3 | 3 |
| 2 | 4 |
| 1 | 5 |
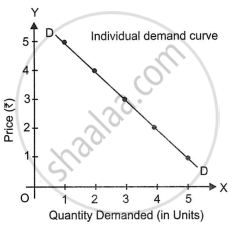
Individual demand curve DD is according to individual demand schedule.
APPEARS IN
संबंधित प्रश्न
Explain the role of the following in correcting ‘deficient demand’ in an economy:
(i) Open market operations.
(ii) Bank rate.
Study the following table and answer the questions:
| Price of Chocolate (₹) | Quantity Demanded | Market Demand | ||
| Consumer A | Consumer B | Consumer C | (A + B + C) | |
| 50 | 4 | 9 | 20 | 33 |
| 100 | 3 | `square` | 15 | 26 |
| 150 | `square` | 7 | 10 | 19 |
| 200 | 1 | 6 | 5 | `square` |
| 250 | 0 | 5 | `square` | 5 |
Questions:
- Complete the above table.
- State whether the following statements are True or False:
(a) As the price rises from ₹50 to ₹250, market demand falls from 33 to 5. This fall in market demand is known as the decrease in demand.
(b) There is an inverse relationship between price and market demand.
Complete the correlation:
______ : Microeconomics : : Aggregate demand : Macroeconomics.
State with reasons whether you agree or disagree with the following statements:
When price of Giffen goods fall, the demand for it increases.
Prepare a hypothetical market demand schedule and draw a market demand curve based on it.
What will be the values of (i) and (ii)?
| Price (in ₹) | Quantity Demanded by | Total Demand | ||
| A | B | C | ||
| 10 | 30 | (i) | 12 | 52 |
| 20 | 20 | 8 | 9 | 37 |
| 30 | 10 | 6 | (ii) | 22 |
Individual demand is a demand by a single buyer.
Shyam, Sita, Renu, Ahmed and John are five consumers of apples. Their demand for apples is given below. Derive the market demand schedule for apples.
| Price per Kg. (In ₹) | Quantity Demanded (Apples) in Kg. | ||||
| Shyam | Sita | Renu | Ahmed | John | |
| 25.00 | 16 | 15 | 12 | 14 | 18 |
| 30.00 | 12 | 11 | 10 | 8 | 15 |
| 35.00 | 10 | 9 | 8 | 6 | 12 |
| 40.00 | 8 | 6 | 4 | 2 | 8 |
How is the demand curve related to the demand schedule?
What distinguishes an individual demand schedule from a market demand schedule?
