Advertisements
Advertisements
प्रश्न
Construct a demand schedule showing relationship between price and quantity demanded.
Advertisements
उत्तर
Hypothetical Individual Demand Schedule
| Price (in ₹) | Quantity demanded (in units) |
| 5 | 1 |
| 4 | 2 |
| 3 | 3 |
| 2 | 4 |
| 1 | 5 |
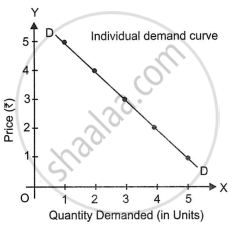
Individual demand curve DD is according to individual demand schedule.
APPEARS IN
संबंधित प्रश्न
The relationship between income and demand for inferior goods is ______.
Observe the following table and answer the following questions:
| Quantity demanded | ||||
| Price per kg. in ₹ | Consumer A |
Consumer B |
Consumer C |
Market demand (in kgs) (A + B + C) |
| 25 | 16 | 15 | 12 | ______ |
| 30 | 12 | 11 | 10 | ______ |
| 35 | 10 | 09 | 08 | ______ |
| 40 | 08 | 06 | 04 | ______ |
- Complete the market demand schedule.
- Draw market demand curves based on the above market demand schedule.
State with reasons whether you agree or disagree with the following statements:
When price of Giffen goods fall, the demand for it increases.
Prepare a hypothetical market demand schedule and draw a market demand curve based on it.
Demand schedule is a list of prices and quantities.
From the following data regarding individual demand schedules of households A, B and market demand schedule, what will be the values of (i) and (ii) (Assuming that there are only 2 households in the market).
| Price (in ₹) | Individual Demand (units) | Market demand (units) | ||
| A | B | C | ||
| 7 | (i) | 16 | 15 | 51 |
| 8 | 18 | 15 | (ii) | 46 |
| 9 | 16 | 12 | 11 | 39 |
| 10 | 13 | 10 | 9 | 32 |
From the given demand schedule, what will be the effect on demand curve.
| Price in (₹) | Demand (units) |
| 20 | 100 |
| 20 | 70 |
What does a demand schedule show?
How is the demand curve related to the demand schedule?
What distinguishes an individual demand schedule from a market demand schedule?
