Advertisements
Advertisements
प्रश्न
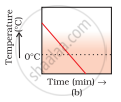
A glass tumbler containing hot water is kept in the freezer compartment of a refrigerator (temperature < 0°C). If you could measure the temperature of the content of the tumbler, which of the following graphs (Fig.1.2) would correctly represent the change in its temperature as a function of time.
पर्याय
Advertisements
उत्तर
The hot water in the glass tumbler kept in the freezer will first become cold and the temperature will drop till 0°C. At 0°C, water loses heat equal to the latent heat of fusion till entire water freezes to form ice at 0°C. During this change of state from liquid to solid, the temperature remains constant.
On still further cooling, the temperature of ice slowly falls with time. Therefore, the correct option is (a).
APPEARS IN
संबंधित प्रश्न
The temperature at which a solid convert into a liquid is called its .........
The fixed temperature at which matter changes state from solid to liquid is called ______.
What are the changes of state in water? Explain.
Analogy:
Melting: ice into water on heating,
freezing: _______.
What is melting? Give example.
A student heats a beaker containing ice and water. He measures the temperature of the content of the beaker as a function of time. Which of the following (Fig. 1.1) would correctly represent the result? Justify your choice.
Water as ice has a cooling effect, whereas water as steam may cause severe burns. Explain these observations.
In an endothermic process, the speed of the molecules is ______ hence they move faster.
Define latent heat of fusion?
Explain the following effects of heat.
Change in state
