Advertisements
Advertisements
प्रश्न
Observe the following graph and answer the question given below

Question:
- Which region has the highest literacy rate?
- Which region has the lowest literacy rate?
- In which region does women fare better than men in literacy rate?
- Write a concluding paragraph about the graph.
- Which is the type of graph?
Advertisements
उत्तर
1. Central Asia has the highest literacy rate.
2. Sub-Saharan Africa has the lowest literacy rate
3. There is no region in which women fare better than men in literacy rate.
4.
- The graph clearly tells us that we find differences in the male and female literacy rate even in the same continent.
- As compared to the global average, the literacy rates are higher in Central Asia, Europe, Northern America as well as Eastern and South-east Asian countries. On the other hand, they are lower in Northern Africa, Western Asia, Southern Asia and Sub-Saharan Africa.
- The male and female literacy rates are equal in Central Asia, Europe and Northern America.
5. This is a horizontal grouped bar graph or a clustered bar chart.
संबंधित प्रश्न
Answer the following question in about 30 words.
‘The agricultural sector has the largest share of Indian workers.’ - Explain.
Name the country with the lowest sex ratio in the world.
Divide population based on the place of residence.
The literacy rate in India is ______.
Favourable sex ratio is found in how many countries.
In how many countries, unfavourable sex ratio is found?
The largest country in Asia Continent in terms of area ______
Study the given graph carefully and answer the following question:
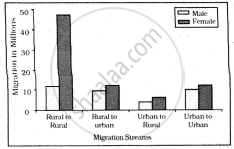
Intra-state Migration by place of Last Residence Indicating Migration Streams India, 2011
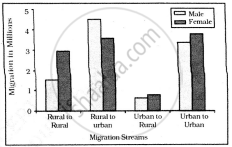
Inter-state Migration by Place of Last Residence Indicating Migration Streams India, 2011
Which stream of migration shows the lowest trend in interstate migration?
Which type of population pyramid shows a bell shape?
Assertion: India is agrarian country.
Reason: Population engaged in agriculture is high in India.
