Advertisements
Advertisements
प्रश्न
Observe the following graph and answer the question given below:

Question:
- Which type of the graph shown above?
- In which age group male percentage is highest?
- In which age group female percentage is lowest?
- Whose percentage is highest in 30-39 age group?
- In which age group female percentage is higher than male percentage?
Advertisements
उत्तर
- The population pyramid which displays the percentage of male and female of different age groups is shown above.
- Male percentage is highest in the age group of 0-9 years.
- Female percentage is lowest in the age group of above 70 years.
- Male percentage is highest in 30-39 age group.
- In age group of 60 to 69, female percentage is higher than male percentage
संबंधित प्रश्न
Identify the incorrect factor
Difference in population according to rural-urban structure:
Write short note
Population pyramid and sex ratio
Where does India rank in the world as regards area?
Bell shaped Pyramid refers to ______.
Study the given graph carefully and answer the following question:
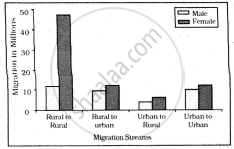
Intra-state Migration by place of Last Residence Indicating Migration Streams India, 2011
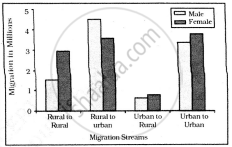
Inter-state Migration by Place of Last Residence Indicating Migration Streams India, 2011
Which stream of migration shows the lowest trend in intra-state migration?
From which of the following do we get information regarding the population of our country?
What does the high proportion of young population implies?
Arrange according to increase in age :
- Adults
- Children
- Old people
- Young people
Assertion: India is agrarian country.
Reason: Population engaged in agriculture is high in India.
Which one of the following is the largest linguistic group of India?
