Advertisements
Advertisements
प्रश्न
Observe the following graph and answer the question given below:

Questions:
- Which pyramid(s) represent(s) a country with high medical expenditure?
- Which pyramid(s) represent(s) a country with a large manpower?
- In which pyramid(s) the number of old people will be the least?
- What is the reason of the broad shape of A pyramid?
- Why C pyramid looks vertical in shape?
Advertisements
उत्तर
- Pyramid B represents a country with high medical expenditure.
- Pyramid C represents a country with a large manpower.
- In pyramid A, the number of old people will be the least.
- Pyramid A has broad shape due to high birth rate and high death rate
- Pyramid C looks vertical in shape due to very low birth rate and very low death rate.
APPEARS IN
संबंधित प्रश्न
Give a geographical reason:
In developed countries, the percentage of the population engaged in agriculture is low.
Differentiate between
Quaternary occupations and Quinary occupations
Name the country with the lowest sex ratio in the world.
Why is an unfavorable female sex ratio found in India and other South Asian countries?
Study the given graph carefully and answer the following question:
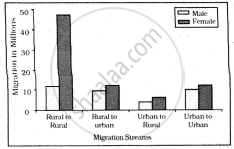
Intra-state Migration by place of Last Residence Indicating Migration Streams India, 2011
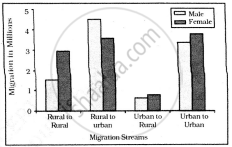
Inter-state Migration by Place of Last Residence Indicating Migration Streams India, 2011
Which stream of migration shows the lowest trend in intra-state migration?
The sex ratio in a country can be expressed as which of the following?
Arrange according to increase in age :
- Adults
- Children
- Old people
- Young people
Assertion: India is agrarian country.
Reason: Population engaged in agriculture is high in India.
Write a short note on:
Demographic dividend.
Which one of the following is the largest linguistic group of India?
