Advertisements
Advertisements
प्रश्न
The temperature (T) dependence of resistivity of materials A and material B is represented by fig (i) and fig (ii) respectively. Identify material A and material B.
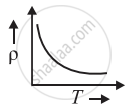 fig. (i) |
 fig. (ii) |
विकल्प
material A is copper and material B is germanium
material A is germanium and material B is copper
material A is nichrome and material B is germanium
material A is copper and material B is nichrome
Advertisements
उत्तर
material A is germanium and material B is copper
APPEARS IN
संबंधित प्रश्न
A heating element using nichrome connected to a 230 V supply draws an initial current of 3.2 A which settles after a few seconds to a steady value of 2.8 A. What is the steady temperature of the heating element if the room temperature is 27.0°C? The temperature coefficient of resistance of nichrome averaged over the temperature range involved is 1.70 × 10⁻⁴ °C−1.
The order of coloured rings in a carbon resistor is red, yellow, blue and silver. The resistance of the
carbon resistor is:
a) 24 x 106 Ω ± 5%
b) 24 x 106 Ω ± 10%
c) 34 x 104 Ω ± 10%
d) 26 x 104 Ω ± 5%
Draw labelled graphs to show how electrical resistance varies with temperature for:
1) a metallic wire.
2) a piece of carbon
Show variation of resistivity of Si with temperature in a graph ?
As the temperature of a metallic resistor is increased, the product of its resistivity and conductivity ____________ .
When a current passes through a resistor, its temperature increases. Is it an adiabatic process?
Find the thermo-emf developed in a copper-silver thermocouple when the junctions are kept at 0°C and 40°C. Use the data given in the following table.
| Metal with lead (Pb) |
a `mu V"/"^oC` |
b `muV"/("^oC)` |
| Aluminium | -0.47 | 0.003 |
| Bismuth | -43.7 | -0.47 |
| Copper | 2.76 | 0.012 |
| Gold | 2.90 | 0.0093 |
| Iron | 16.6 | -0.030 |
| Nickel | 19.1 | -0.030 |
| Platinum | -1.79 | -0.035 |
| Silver | 2.50 | 0.012 |
| Steel | 10.8 | -0.016 |
Find the neutral temperature and inversion temperature of a copper-iron thermocouple if the reference junction is kept at 0°C. Use the data given in the following table.
| Metal with lead (Pb) |
a `mu V"/"^oC` |
b `muV"/("^oC)` |
| Aluminium | -0.47 | 0.003 |
| Bismuth | -43.7 | -0.47 |
| Copper | 2.76 | 0.012 |
| Gold | 2.90 | 0.0093 |
| Iron | 16.6 | -0.030 |
| Nickel | 19.1 | -0.030 |
| Platinum | -1.79 | -0.035 |
| Silver | 2.50 | 0.012 |
| Steel | 10.8 | -0.016 |
A carbon resistor has coloured bands as shown in Figure 2 below. The resistance of the resistor is:
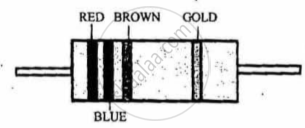
figure 2
