Advertisements
Advertisements
प्रश्न
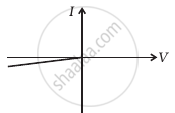
The graph shown in the figure represents a plot of current versus voltage for a given semiconductor. Identify the region, if any, over which the semiconductor has a negative resistance.

Advertisements
उत्तर
Resistance of a material can be found out by the slope of the curve V vs. I. Part BC of the curve shows the negative resistance as with the increase in current, voltage decreases.
APPEARS IN
संबंधित प्रश्न
(i) Explain with the help of a diagram the formation of depletion region and barrier potential in a pn junction.
What happens when a forward bias is applied to a p-n junction?
Basic materials used in the present solid state electronic devices like diode, transistor, ICs, etc are ______.
We use alloys for making standard resistors because they have ____________.
The drift current in a p-n junction is from the ______.
The nature of binding for a crystal with alternate and evenly spaced positive and negatively ions is
Avalanche breakdown is due to ______.
Consider a box with three terminals on top of it as shown in figure (a):
 (a) |
Three components namely, two germanium diodes and one resistor are connected across these three terminals in some arrangement. A student performs an experiment in which any two of these three terminals are connected in the circuit shown in figure (b).
 (b) |
The student obtains graphs of current-voltage characteristics for unknown combination of components between the two terminals connected in the circuit. The graphs are
(i) when A is positive and B is negative
 (c) |
(ii) when A is negative and B is positive
 (d) |
(iii) When B is negative and C is positive
|
(e) |

(iv) When B is positive and C is negative
 (f) |
(v) When A is positive and C is negative
 (g) |
(vi) When A is negative and C is positive
 (h) |
From these graphs of current-voltage characteristics shown in figure (c) to (h), determine the arrangement of components between A, B and C.
Answer the following giving reasons:
A p-n junction diode is damaged by a strong current.
Choose the correct circuit which can achieve the bridge balance.
