Advertisements
Advertisements
प्रश्न
The following table gives the number of small-scale units registered with the Directorate of Industries between 1985 and 1991. Show the growth on a trend line by the free hand method.
| Year | No. of units (in '000) |
| 195 | 10 |
| 986 | 22 |
| 1987 | 36 |
| 198 | 62 |
| 1989 | 55 |
| 1990 | 0 |
| 1991 | 34 |
| 1992 | 50 |
Advertisements
उत्तर
We follow the procedure as given below:
(a) Plot the data on a graph
(b) Join all the points by a free hand smooth curve
(c) A line is drawn which passes through the maximum number of plotted points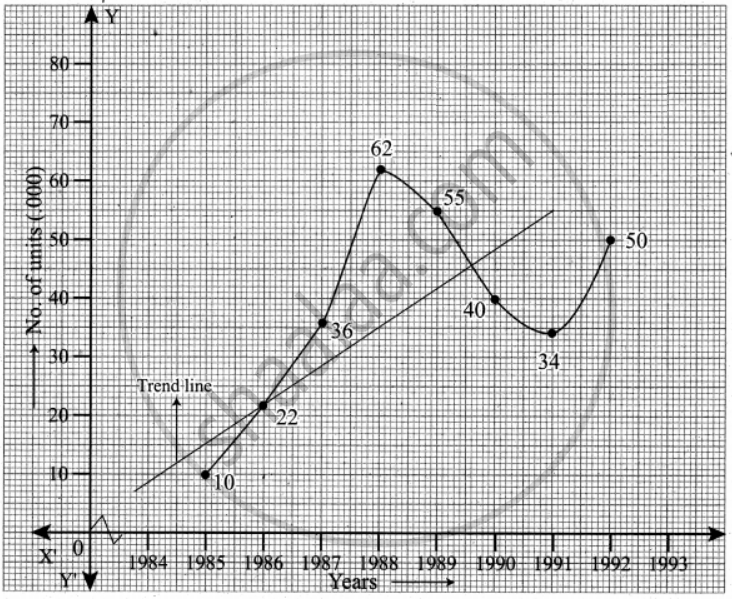
APPEARS IN
संबंधित प्रश्न
Define Time series
What is the need for studying time series?
Write a brief note on seasonal variations
State the two normal equations used in fitting a straight line
State the different methods of measuring trend
The following table shows the number of salesmen working for a certain concern:
| Year | 1992 | 1993 | 1994 | 1995 | 1996 |
| No. of salesman |
46 | 48 | 42 | 56 | 52 |
Use the method of least squares to fit a straight line and estimate the number of salesmen in 1997
Choose the correct alternative:
Least square method of fitting a trend is
Choose the correct alternative:
The component of a time series attached to long term variation is trended as
What is the sum of the first 50 terms of the series (1 × 3) + (3 × 5) + (5 × 7) + ...?
The sum of the series 3.6 + 4.7 + 5.8 + ....... upto (n – 2) terms
