Advertisements
Advertisements
प्रश्न
The following table gives the number of small-scale units registered with the Directorate of Industries between 1985 and 1991. Show the growth on a trend line by the free hand method.
| Year | No. of units (in '000) |
| 195 | 10 |
| 986 | 22 |
| 1987 | 36 |
| 198 | 62 |
| 1989 | 55 |
| 1990 | 0 |
| 1991 | 34 |
| 1992 | 50 |
Advertisements
उत्तर
We follow the procedure as given below:
(a) Plot the data on a graph
(b) Join all the points by a free hand smooth curve
(c) A line is drawn which passes through the maximum number of plotted points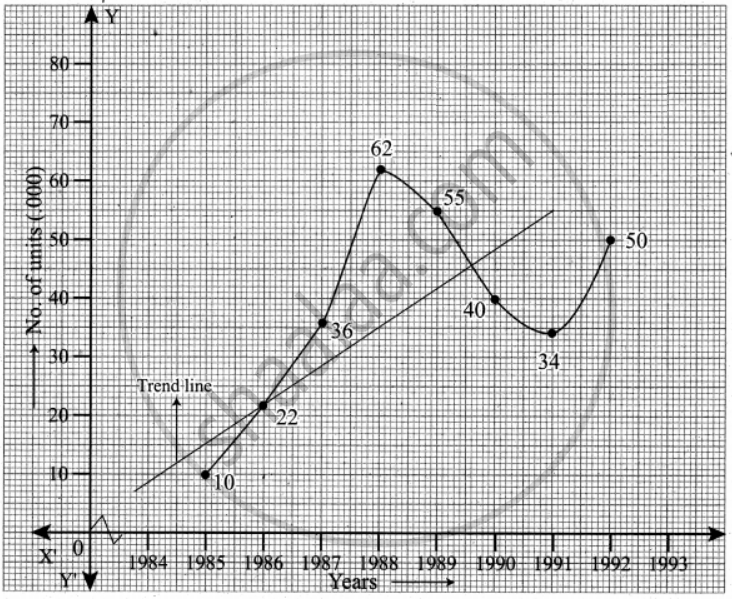
APPEARS IN
संबंधित प्रश्न
Discuss about irregular variation
State the two normal equations used in fitting a straight line
The following figures relates to the profits of a commercial concern for 8 years
| Year | Profit (₹) |
| 1986 | 15,420 |
| 1987 | 15,470 |
| 1988 | 15,520 |
| 1989 | 21,020 |
| 1990 | 26,500 |
| 1991 | 31,950 |
| 1992 | 35,600 |
| 1993 | 34,900 |
Find the trend of profits by the method of three yearly moving averages
The annual production of a commodity is given as follows:
| Year | production (in tones) |
| 1995 | 155 |
| 1996 | 162 |
| 1997 | 171 |
| 19988 | 182 |
| 1999 | 158 |
| 2000 | 880 |
| 2001 | 178 |
Fit a straight line trend by the method of least squares
Use the method of monthly averages to find the monthly indices for the following data of production of a commodity for the years 2002, 2003 and 2004
| 2002 | 2003 | 2004 |
| 15 | 20 | 18 |
| 18 | 18 | 25 |
| 17 | 16 | 21 |
| 19 | 13 | 11 |
| 16 | 12 | 14 |
| 20 | 15 | 16 |
| 21 | 22 | 19 |
| 18 | 16 | 20 |
| 17 | 18 | 1 |
| 15 | 20 | 16 |
| 14 | 17 | 18 |
| 18 | 15 | 20 |
Calculate the seasonal indices from the following data using the average method:
| Year | I Quarter | II Quarter | III Quarter | IV Quarter |
| 2008 | 72 | 68 | 62 | 76 |
| 2009 | 78 | 74 | 78 | 72 |
| 2010 | 74 | 70 | 72 | 76 |
| 2011 | 76 | 74 | 74 | 72 |
| 2012 | 72 | 72 | 76 | 68 |
Choose the correct alternative:
Least square method of fitting a trend is
Choose the correct alternative:
The seasonal variation means the variations occurring with in
A bullet of mass m and velocity a is fired into a large block of wood of mass M The final velocity of the system is
Sum of the first n terms of the series `1/2 + 3/4 + 7/8 + 15/16 +`......... is equal to:
