Advertisements
Advertisements
प्रश्न
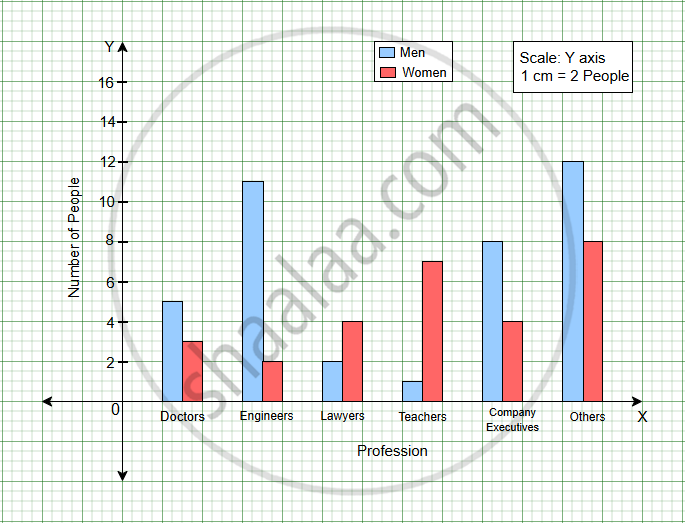
The following table gives the data about the people in a society who were asked about their profession.
| Profession | Doctors | Engineers | Lawyers | Teachers | Company Executives |
Others |
| Men | 5 | 11 | 2 | 1 | 8 | 12 |
| Women | 3 | 2 | 4 | 7 | 4 | 10 |
Draw a compound bar graph.
आलेख
Advertisements
उत्तर
shaalaa.com
क्या इस प्रश्न या उत्तर में कोई त्रुटि है?
