मराठी

The following table gives the data about the people in a society who were asked about their profession. Profession Doctors, Engineers, Lawyers, Teachers, Company Executives, Others, Men 5, 11, 2, 1,

Advertisements
Advertisements

प्रश्न

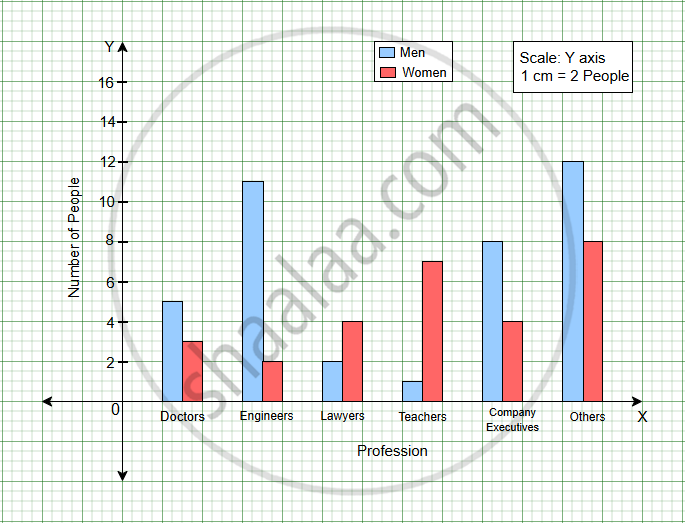
The following table gives the data about the people in a society who were asked about their profession.

Profession Doctors Engineers Lawyers Teachers Company
Executives
Others
Men 5 11 2 1 8 12
Women 3 2 4 7 4 10

Draw a compound bar graph.

आलेख
Advertisements

उत्तर
shaalaa.com
  या प्रश्नात किंवा उत्तरात काही त्रुटी आहे का?
पाठ 16: Graphical Representation of Statistical Data - EXERCISE 16 [पृष्ठ १९५]

APPEARS IN

बी निर्मला शास्त्री Mathematics [English] Class 9 ICSE
पाठ 16 Graphical Representation of Statistical Data
EXERCISE 16 | Q 2. | पृष्ठ १९५
Share
Notifications

Englishहिंदीमराठी


      Forgot password?
Use app×