Advertisements
Advertisements
प्रश्न
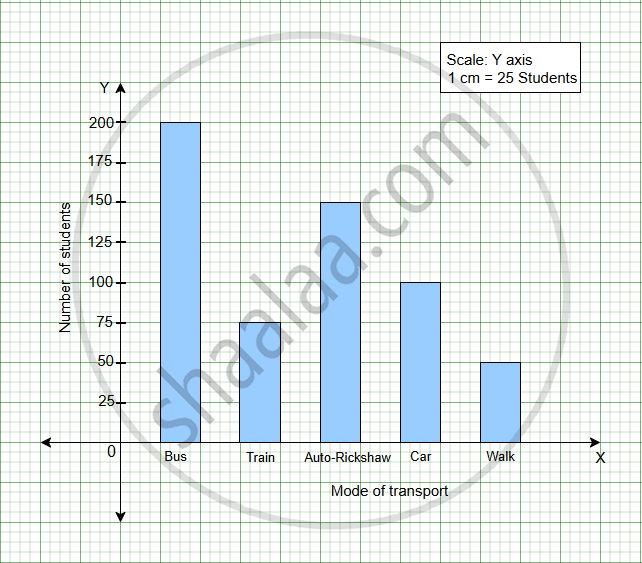
The following table shows the mode of transport used by students of a school. Taking a suitable scale, draw a bar graph.
| Mode of transport | Bus | Train | Auto-Rickshaw | Car | Walk |
| Number of students | 200 | 75 | 150 | 100 | 50 |
आलेख
Advertisements
उत्तर
shaalaa.com
क्या इस प्रश्न या उत्तर में कोई त्रुटि है?
