Advertisements
Advertisements
प्रश्न
Show variation of resistivity of Si with temperature in a graph ?
Advertisements
उत्तर
The resistivity of Silicon with temperature is shown as

APPEARS IN
संबंधित प्रश्न
Draw labelled graphs to show how electrical resistance varies with temperature for:
1) a metallic wire.
2) a piece of carbon
The thermal energy developed in a current-carrying resistor is given by U = i2 Rt and also by U = Vit. Should we say that U is proportional to i2 or i?
Consider a circuit containing an ideal battery connected to a resistor. Do "work done by the battery" and "the thermal energy developed" represent two names of the same physical quantity?
Sometimes it is said that "heat is developed" in a resistance when there is an electric current in it. Recall that heat is defined as the energy being transferred due to temperature difference. Is the statement in quotes technically correct?
When a current passes through a resistor, its temperature increases. Is it an adiabatic process?
An electric kettle used to prepare tea, takes 2 minutes to boil 4 cups of water (1 cup contains 200 cc of water) if the room temperature is 25°C. (a) If the cost of power consumption is Re 1.00 per unit (1 unit = 1000 watt-hour), calculate the cost of boiling 4 cups of water. (b) What will be the corresponding cost if the room temperature drops to 5°C?
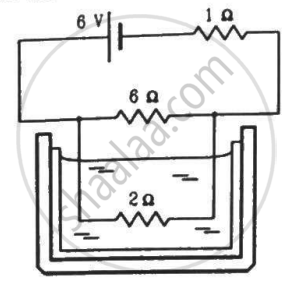
The 2.0 Ω resistor shown in the figure is dipped into a calorimeter containing water. The heat capacity of the calorimeter together with water is 2000 J K−1. (a) If the circuit is active for 15 minutes, what would be the rise in the temperature of the water? (b) Suppose the 6.0 Ω resistor gets burnt. What would be the rise in the temperature of the water in the next 15 minutes?
A carbon resistor has coloured bands as shown in Figure 2 below. The resistance of the resistor is:
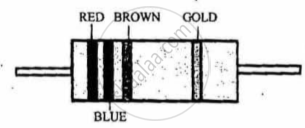
figure 2
The higher and lower fixed points on a thermometer are separated by 160 mm. When the length of the mercury thread above the lower point is 40 mm, the temperature reading would be :
Water at 10°C enters into a geyser. The water drawn out from the geyser has a temperature of 60°C and the rate of outflow of water is 18 kg/hr. The rating of the geyser is :
