Advertisements
Advertisements
प्रश्न
| Number of people living together | How many families |
| 1 alone | 2 |
| 2 people | 5 |
| 3 people | 8 |
| 4 people | 6 |
| 5 people | 4 |
| 6 people | 2 |
| 7 people | 2 |
| 8 people | 1 |
The number of families having 4 people is ______.
विकल्प
4
2
1
6
Advertisements
उत्तर
The number of families having 4 people is 6.
APPEARS IN
संबंधित प्रश्न
Find out from 20 friends the programmes they like and dislike, and write in a table.
| Kind of programme |
Number of children liking it |
Number of children disliking it |
| News | ||
| Serials | ||
| Cartoons | ||
| Comedy shows | ||
| Sports |
- Which kind of programme is liked by most children?
- Which kind of programme is disliked by the least number of children?
- How many children like sports programmes?
- Is there any kind of programme not liked by anyone? Yes/No. If yes, which one?
Read the poem carefully and answer these questions.
- Which word comes most often in the poem?
- Which letter has been used most?
- Which letter comes the least?
Find out from your classmates and fill the table.
| Main food | Number of persons |
| Rice | |
| Wheat | |
Look at the table and tell :
- Most children eat food made from ______
- Compared to children who eat rice, those who eat wheat are more/less/equal.
- Compare to those who eat wheat, children eating ragi are more/less.
Answer the following question.
Answer the following question.
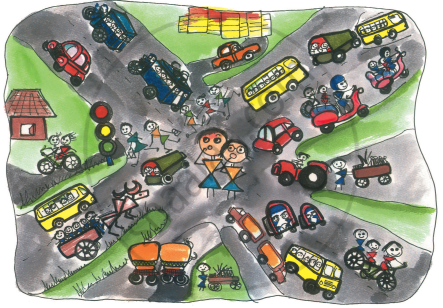
Which way of travel (vehicle) do you see the least?
| Face of the die | Number of times ( / for each throw) |
 |
| | | | | |
 |
| | | |
 |
| | | | | |
 |
| | | | |
 |
| | | | | | | |
 |
| | | | | | |
came up more number of times than ______.
Talk to people around you about their favourite sweets. Fill in the table:
| Favourite sweet | Number of people |
| Jalebi | |
|
Attendance Board Date 8/2/2007 |
|||
| Class | Number of Students | Students Present | Students absent |
| Class I | 27 | 25 | 2 |
| Class II | 23 | 22 | 1 |
| Class III | 24 | 21 | 3 |
| Class IV | 22 | 18 | 4 |
| Class V | 25 | 23 | 2 |
| Total | |||
This board shows the number of students in each class. It also shows the number of students present and absent.
How many children in all are absent on that day?
- Make a group of 4 friends.
- Cut strips from waste paper. The strips should be of the same width.
- Measure the length of each student's hand with the paper strip. Cut the strip and write the name of the student.
| Animal | Cow | Buffalo | Dog | Cat | Rabbit |
| Number of people who pet them | 30 | 20 | 50 | 10 | 5 |
Which animal is liked most as a pet?
Which vegetable is most disliked? Ask your friends and complete the table.
| Vegetable disliked | Number of students |
