Advertisements
Advertisements
प्रश्न
Giving reason, comment on the shape of Production Possibilities Curve based on the following table :
| Good X (units) | Good Y (units) |
| 0 | 4 |
| 1 | 3 |
| 2 | 2 |
| 3 | 1 |
| 4 | 0 |
Advertisements
उत्तर
Based on the below schedule, we can say that PPC is a downward sloping straight line. This is because the opportunity cost of producing one good (i.e. Good X) in terms of another (i.e. Good Y) remains the same, that is, 1 (ignoring the minus sign).
| Good X (units) | Good Y (units) | Opportunity Cost |
| 0 | 4 | - |
| 1 | 3 | 1 |
| 2 | 2 | 1 |
| 3 | 1 | 1 |
| 4 | 0 | 1 |
The following figure depicts the shape of PPC.
Thus, the shape of PPC is downward sloping straight line which can be attributed to the constant opportunity cost.
APPEARS IN
संबंधित प्रश्न
A large number of technical training institutions have been started by the government. State its economic value in the context of production possibilities frontier.
Answer the following question.
Explain the meaning of opportunity cost with the help of a production possibility schedule.
Define flow variable.
Define flow variable.
What do you mean by the production possibilities of an economy?
What is a production possibility frontier?
Choose the correct alternative from given options:
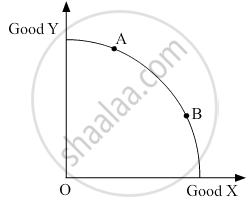
In the given figure, the movement on the production possibility curve from point A to point B shows _____________.
______ are economic units that carry out the production.
Production possibility curve slopes downwards from ______ to ______.
Which of the following is the result of increase in price of factors of production?
Which of the following statement is true:
______ shows the functional relationship between output and cost of production.
Which of the following statement is false?
