Advertisements
Advertisements
प्रश्न
Given below is a schematic diagram to illustrate some aspects of photosynthesis.
- Fill up the gaps, in blank spaces (1-4), by writing the names of the correct items.
- What phenomenon do the thick arrows A and B indicate?

Advertisements
उत्तर
-
- Sunlight
- Oxygen
- Glucose
- Water
-
- Transpiration
- Ascent of sap
APPEARS IN
संबंधित प्रश्न
Are the following statement true or false? Give a reason in support of your answer.
Destarching of the leaves of a potted plant can occur only at night.
Given below is the representation of a certain phenomenon in nature. With four organisms 1-4.
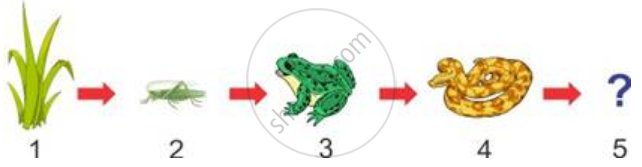
Name one natural element which all the organisms 2-4 and even 5 are getting from No. 1 for their survival.
A potted plant was taken in order to prove a factor necessary for photosynthesis. The potted plant was kept in the dark for 24 hours. One of the leaves was covered with black paper in the centre. The potted plant was then placed in sunlight for a few hours.
Why was the plant placed in the dark before beginning the experiment?
ATP is needed for the dark reaction.
Differentiate Between:
Light reaction and Dark reaction.
Give technical term:
Name only one plant, you are familiar with which has no chlorophyll.
Complete the following sentence with appropriate word:
________ are regarded as complete photosynthetic units of plants.
Choose the Correct Answer:
The main difference between chlorophyll ‘a’ and ‘b’ is:
Give reasons/explain:
During the starch test, the leaf is boiled in methylated spirit.
Given below is the diagram of an experimental set-up (final stage). Study the same and answer the following questions:

- What is the main aim of the experiment?
- Oxygen gas shown in the experiment is released from which of the raw materials?
- How would you confirm the presence of oxygen gas?
- Name the chemical substance which can be added in water to enhance the process/rate of release of oxygen gas.
- Draw a neat and labelled diagram of the same experiment for its initial stage.
