Advertisements
Advertisements
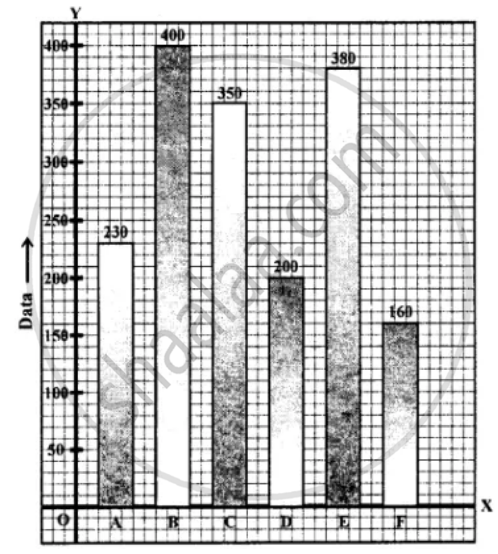
प्रश्न
For the following table, draw a bar-graph
| A | B | C | D | E | F |
| 230 | 400 | 350 | 200 | 380 | 160 |
Advertisements
उत्तर
APPEARS IN
संबंधित प्रश्न
Given below are the seats won by different political parties in the polling outcome of a state assembly elections:-
| Political Party | A | B | C | D | E | F |
| Seats Won | 75 | 55 | 37 | 29 | 10 | 37 |
- Draw a bar graph to represent the polling results.
- Which political party won the maximum number of seats?
Read the bar graph shown in Fig. 23.8 and answer the following questions:

(i) What is the information given by the bar graph?
(ii) How many tickets of Assam State Lottery were sold by the agent?
(iii) Of which state, were the maximum number of tickets sold?
(iv) State whether true or false.
The maximum number of tickets sold is three times the minimum number of tickets sold.
(v) Of which state were the minimum number of tickets sold?
Study the bar graph representing the number of persons in various age groups in a town shown in Fig. below. Observe the bar graph and answer the following questions:
(i) What is the percentage of the youngest age-group persons over those in the oldest age group?
(ii) What is the total population of the town?
(iii) What is the number of persons in the age group 60 - 65?
(iv) How many persons are more in the age-group 10 - 15 than in the age group 30 - 35?
(v) What is the age-group of exactly 1200 persons living in the town?
(vi) What is the total number of persons living in the town in the age-group 50 - 55?
(vii) What is the total number of persons living in the town in the age-groups 10 - 15 and 60 - 65?

(viii) Whether the population in general increases, decreases or remains constant with the increase in the age-group.
Read the following bar graph(Fig. 23.15) and answer the following questions:
(i) What information is given by the bar graph?
(ii) What was the production of a student in the year 1980 - 81?
(iii) What is the minimum and maximum productions of cement and corresponding years?

Read the bar graph given in Fig. 23.17 and answer the following questions:
(i) What information is given by the bar graph?
(ii) What was the crop-production of rice in 1970 - 71?
(iii) What is the difference between the maximum and minimum production of rice?

The population of Delhi State in different census years is as given below:
| Census year | 1961 | 1971 | 1981 | 1991 | 2001 |
| Population in Lakhs | 30 | 55 | 70 | 110 | 150 |
In the 'less than' type of ogive the cumulative frequency is plotted against
Draw frequency polygons for each of the following frequency distribution:
(a) using histogram
(b) without using histogram
|
C.I |
5 -15 | 15 -25 | 25 -35 | 35 - 45 | 45-55 | 55-65 |
| ƒ | 8 | 16 | 18 | 14 | 8 | 2 |
In the following figure, there is a histogram depicting daily wages of workers in a factory. Construct the frequency distribution table.

The lengths of 62 leaves of a plant are measured in millimetres and the data is represented in the following table:
| Length (in mm) | Number of leaves |
| 118 – 126 | 8 |
| 127 – 135 | 10 |
| 136 – 144 | 12 |
| 145 – 153 | 17 |
| 154 – 162 | 7 |
| 163 – 171 | 5 |
| 172 – 180 | 3 |
Draw a histogram to represent the data above.
