हिंदी

Explain graphically the following: Relatively Elastic Supply

Advertisements
Advertisements

प्रश्न

Explain graphically the following:

Relatively Elastic Supply

स्पष्ट कीजिए
Advertisements

उत्तर

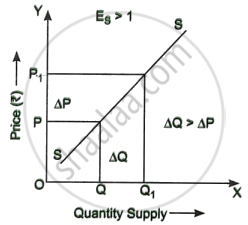
The graph represents relatively elastic supply (Es > 1), meaning a small change in price leads to a large change in quantity supplied. The supply curve is flatter, indicating that sellers can easily adjust supply in response to price changes. In the graph, when price rises from P to P1, the quantity supplied increases by a larger amount from Q to Q1 (AQ > AP).

shaalaa.com
  क्या इस प्रश्न या उत्तर में कोई त्रुटि है?
अध्याय 3: Theory of Supply - QUESTIONS [पृष्ठ ८०]

APPEARS IN

गोयल ब्रदर्स प्रकाशन Economic Applications [English] Class 10 ICSE
अध्याय 3 Theory of Supply
QUESTIONS | Q 20. (b) 1. | पृष्ठ ८०
Share
Notifications

Englishहिंदीमराठी


      Forgot password?
Use app×