Advertisements
Advertisements
प्रश्न
Draw the graphs of the lines x = –2 and y = 3. Write the vertices of the figure formed by these lines, the x-axis and the y-axis. Also, find the area of the figure.
Advertisements
उत्तर
1. Graphical representation
The line x = –2 is a vertical line passing through x = –2 on the x-axis.
The line y = 3 is a horizontal line passing through y = 3 on the y-axis.
The x-axis is the line y = 0.
The y-axis is the line x = 0.
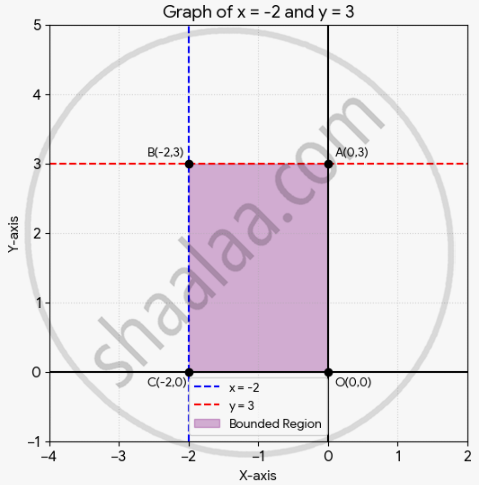
2. Vertices of the figure
By finding the pairwise intersections of the four lines, we get the coordinates of the four vertices:
Origin (intersection of x-axis and y-axis): O(0, 0)
Intersection of x = –2 and x-axis (y = 0): C(–2, 0)
Intersection of x = –2 and y = 3: B(–2, 3)
Intersection of y-axis (x = 0) and y = 3: A(0, 3)
3. Area of the figure
The enclosed region forms a rectangle. Its dimensions are calculated by finding the absolute lengths:
Length (along x-axis) = |0 – (–2)| = 2 units
Width (along y-axis) = |3 – 0| = 3 units
Area = Length × Width
= 2 × 3
= 6 square units
