Advertisements
Advertisements
प्रश्न
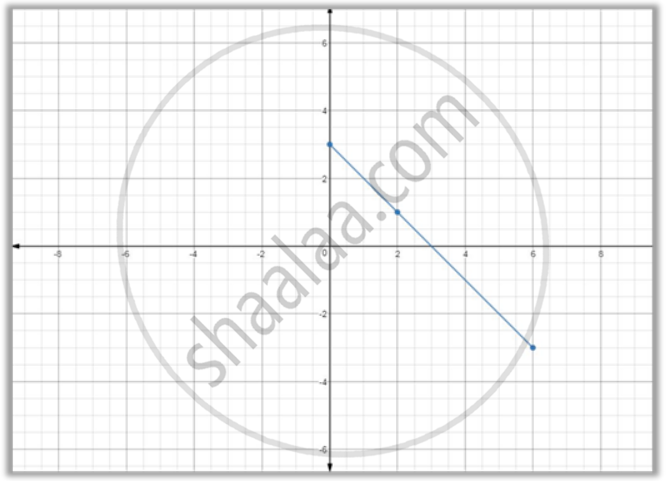
Draw a graph of each of the following equations: x + y - 3 = 0
Advertisements
उत्तर
x + y - 3 = 0
⇒ y = 3 - x
When x = 2, y = 3 2 = 1
When x = 0, y = 3 - 0 = 3
When x = 6, = 3 - 6 = - 3
| x | 2 | 0 | 6 |
| y | 1 | 3 | -3 |
Plotting the points (2, 1), (0, 3) and (6, -3), we get a line AB as shown in the figure.
APPEARS IN
संबंधित प्रश्न
Draw the graph of the equation given below.
2x + y = 1
The following distribution gives the daily income of 50 workers of a factory.
| Daily income (in ₹) | 200-220 | 220-240 | 240-260 | 260-280 | 280-300 |
| Number of workers | 12 | 14 | 8 | 6 | 10 |
Convert the distribution above to a 'less than type' cumulative frequency distribution and draw its ogive.
Draw the graph for the linear equation given below:
x - 5 = 0
Draw the graph for the linear equation given below:
y = 4
Draw the graph for the linear equation given below:
3x + 2y = 0
Draw the graph for the each linear equation given below:
y = `(3x)/(2) + (2)/(3)`
Draw the graph for the linear equation given below:
x + 5y + 2 = 0
On the same graph paper, plot the graphs of y = 2x - 1, y = 2x and y = 2x + 1 from x = - 2 to x = 4. Are the graphs (lines) drawn parallel to each other?
Draw a graph of each of the following equations: 5x + 2y = 16
Draw a graph of the equation 5x - 3y = 1. From the graph find the value of:
(i) x, when y = 8
(ii) y, when x = 2
