Advertisements
Advertisements
प्रश्न
Bus X travels a distance of 360 km in 5 hours whereas bus Y travels a distance of 476 km in 7 hours. Which
bus travels faster ?
Advertisements
उत्तर
We should first consider Bus X.
Distance travelled (d1) = 360 km
Time taken (d1) = 5 hr
So, we can calculate the speed as :
`"Speed" = "Distance"/"Time"`
Thus , the speed of Bus X is 72 km/h.
Similarly,
For Bus Y :
Distance travelled
Time taken (t2) = 7 hr
So , we can calculate the speed as :
`"Speed" = "Distance"/"Time"`
Thus , the speed of Bus Y is 68 km/h.
Speed of Bus X is more than of Bus Y. Hence , Bus X travels Faster .
APPEARS IN
संबंधित प्रश्न
During an experiment, a signal from a spaceship reached the ground station in five minutes. What was the distance of the spaceship from the ground station? The signal travels at the speed of light, that is, 3 × 10⁸m s−1.
If a bus travelling at 20 m/s is subjected to a steady deceleration of 5 m/s2, how long will it take to come to rest ?
The distance between Delhi and Agra is 200 km. A train travels the first 100 km at a speed of 50 km/h. How fast must the train travel the next 100 km, so as to average 70 km/h for the whole journey ?
Which of the following can sometimes be 'zero' for a moving body?
(i) average velocity
(ii) distance travelled
(iii) average speed
(iv) displacement
One of the following is not a vector quantity. This one is :
A car travels the first 30 km with a uniform speed of 60 km h−1 and the next 30 km with a uniform speed of 40 km h−1. Calculate :
- The total time of journey,
- The average speed of the car.
For the motion with uniform velocity , how is the distance travelled related to the time ?
The velocity-time graph of a moving body is given below in Figure
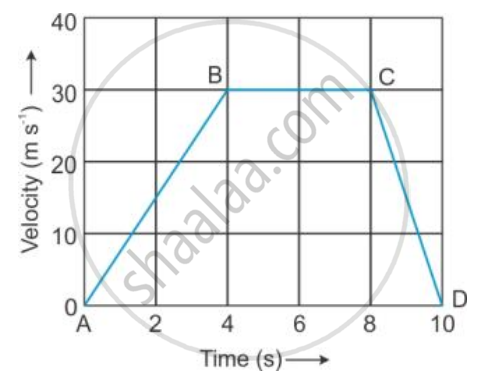
The acceleration in parts AB, BC and CD.
A train is moving with a velocity of 90 km h-1 . It is brought to stop by applying the brakes which produce a retardation of 0.5 ms-2 Find :
(i) The velocity after 10 s , and
(ii) the time taken by the train to come to rest .
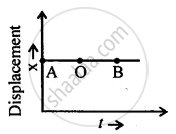
Write down the type of motion of a body along with the A – O – B of the following distance – time graph.