Advertisements
Advertisements
प्रश्न
Answer the following question.
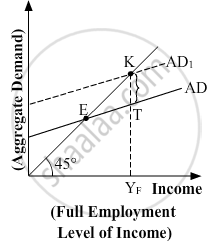
In the given figure, what does the gap 'KT' represent? State any two fiscal measures to correct the situation.
Advertisements
उत्तर
The gap 'KT' represents the inflationary gap. This is the situation of excess demand.
Fiscal policy refers to the policy that is undertaken by the government to influence the economy through the process of its expenditure and taxation.
The fiscal measures to correct the excess demand are given as follows:
- Government Expenditure: The Government of a country incurs various types of expenditure to enhance the welfare of the people and also to facilitate economic growth and development.
In case of excess demand, the government cuts down its expenditures in the form of disinvestment. This lowers the level of economic activity, which in turn, reduces the level of employment, thereby reducing the income level. This subsequently reduces the aggregate demand, thus, the situation of excess demand gets corrected. - Public Borrowings: Through the measure of public borrowings, the government affects the liquidity (cash balances) held by the public. It is because of the excess liquidity, the people demand more and vice-versa. Therefore, the government affects the liquidity balances with the help of public borrowings.
In the case of excess demand, the government raises public borrowings, which reduces the liquidity balances with the public. A reduction in the liquidity lowers the purchasing power of the people, which in turn, lowers the aggregate demand.
संबंधित प्रश्न
‘The fiscal deficit gives the borrowing requirement of the government’. Elucidate.
Consider an economy described by the following functions:- C = 20 + 0.80Y, I = 30, G = 50, TR = 100 (a) Find the equilibrium level of income and the autonomous expenditure multiplier in the model. (b) If government expenditure increases by 30, what is the impact on equilibrium income? (c) If a lump-sum tax of 30 is added to pay for the increase in government purchases, how will equilibrium income change?
We suppose that C = 70 + 0.70Y D, I = 90, G = 100, T = 0.10Y (a) Find the equilibrium income. (b) What are tax revenues at equilibrium Income? Does the government have a balanced budget?
Suppose marginal propensity to consume is 0.75 and there is a 20 per cent proportional income tax. Find the change in equilibrium income for the following (a) Government purchases increase by 20 (b) Transfers decrease by 20.
Explain the relation between government deficit and government debt.
Does public debt impose a burden? Explain.
Discuss the issue of deficit reduction.
Classify the following statement into positive economic or normative economic, with suitable reason:
Government should try to control the rising fiscal deficit.
A fiscal deficit is equal to borrowings. It is ______
What is relation between government deficit and government debt?
______ are the transactions between the residents of two countries that take place due to consideration of profit.
______ are those transactions that are undertaken to cover deficit or surplus in autonomous transactions.
Which of the following transactions are correct about ORT?
Identify which of the following statements is true.
A large amount of fiscal deficit proves to be counter productive. Give any two reasons in support of this statement.
A Budget Deficit refers to a situation where:
Which of the following formulas correctly defines the Revenue Deficit?
The Primary Deficit shows the borrowing requirement of the government:
