Advertisements
Advertisements
प्रश्न
Watching TV/listening to the radio…
- ______ children spend more than 6 hours in a week.
- ______ children spend no time at all.
- Most children spend ______ hours in a week.
- ______ children spend more than 3 hours.
रिकाम्या जागा भरा
Advertisements
उत्तर
- 20 children spend more than 6 hours in a week.
- 10 children spend no time at all.
- More children spend 20 hours in a week.
- 101 children spend more than 3 hours.
shaalaa.com
Smart Charts
या प्रश्नात किंवा उत्तरात काही त्रुटी आहे का?
APPEARS IN
संबंधित प्रश्न
- Ask people in your family to name one programme they like and one programme they dislike. Make a table.
Family member Programme they like Programme they dislike Mother Father - The kind of programme most family members like ______
- The kind of programme most family members dislike ______
Find out from 20 friends the programmes they like and dislike, and write in a table.
| Kind of programme |
Number of children liking it |
Number of children disliking it |
| News | ||
| Serials | ||
| Cartoons | ||
| Comedy shows | ||
| Sports |
- Which kind of programme is liked by most children?
- Which kind of programme is disliked by the least number of children?
- How many children like sports programmes?
- Is there any kind of programme not liked by anyone? Yes/No. If yes, which one?

- How many children are acting in the drama?
- Which are more-children making the sets or those acting?
- What is being done by most of the children?
- How many children are collecting dresses?
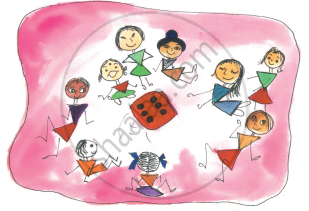
Have you played any games with dice?
Rabia threw her die 30 times. She got  five times. In her table she marked:
Now fill in the table:
| Face of the die | Number of times ( / for each throw) |
 |
|
 |
|
 |
|
 |
|
 |
|
 |
| Face of the die | Number of times ( / for each throw) |
|
| | | | | |
|
| | | |
|
| | | | | |
|
| | | | |
|
| | | | | | | |
|
| | | | | | |
Compare your table with that of the student sitting next to you. Do you find any difference in the two tables?
| Number of people living together | How many families |
| 1 alone | 2 |
| 2 people | 5 |
| 3 people | 8 |
| 4 people | 6 |
| 5 people | 4 |
| 6 people | 2 |
| 7 people | 2 |
| 8 people | 1 |
The least number of people living in a home is ______
| Absent Students' Chart | |
| Class | Absent student |
| Class I |   |
| Class II |  |
| Class III |    |
| Class IV |     |
| Class V |   |
Now look at the chart and fill in the blanks:
The number of students absent in Class IV and Class V are ______ and ______.
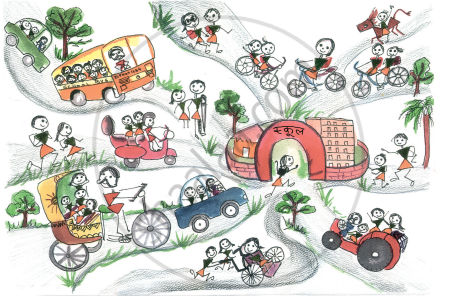
Look at the picture and fill in the table.
| Way of coming | Tractor | ______ | ______ | ______ |
| Number of students | 3 | ______ | ______ | ______ |
| Bird | Sparrow | Crow | Parrot | Peacock | Hen |
| Colours | 2 | 1 | 2 | 10 | 4 |
Which bird has the most colours?
