Advertisements
Advertisements
प्रश्न
Find out from 20 friends the programmes they like and dislike, and write in a table.
| Kind of programme |
Number of children liking it |
Number of children disliking it |
| News | ||
| Serials | ||
| Cartoons | ||
| Comedy shows | ||
| Sports |
- Which kind of programme is liked by most children?
- Which kind of programme is disliked by the least number of children?
- How many children like sports programmes?
- Is there any kind of programme not liked by anyone? Yes/No. If yes, which one?
Advertisements
उत्तर
| Kind of programme |
Number of children liking it |
Number of children disliking it |
| News | 10 | 10 |
| Serials | 2 | 18 |
| Cartoons | 19 | 1 |
| Comedy shows | 18 | 2 |
| Sports | 20 | 0 |
- Most of the children like Cartoon and Sports programme.
- Cartoon and Sport are disliked by least children.
- 20 (all) children like sports programmes.
- No.
APPEARS IN
संबंधित प्रश्न
Use a scale and find out from your chart:
- The length of the longest strip is ______ cm.
- So, ______ has the biggest head.
- The smallest strip is ______ cm long. It belongs to ______
All children of a school take part in different clubs:
The Chapati Chart shows the number of children in different clubs.

From the picture we can see that:
- Half the children in the class take part in the Games Club.
- One fourth of the children are members of the Garden Club.
- The Drawing Club has one fourth of the children of the class.
If there are 200 students in the school, look at the above Chapati Chart and tell the number of members in each club :
- The Games Club has ______ members.
- The Garden Club has ______ members.
- There are ______ members in the Drawing Club.
 |
 |
 |
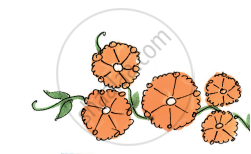 |
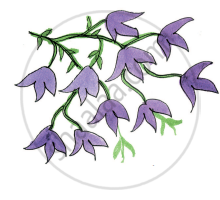
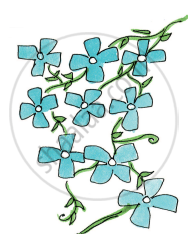
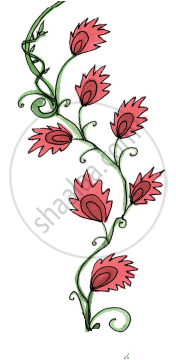
| Colour of flowers | Number of flowers |
| Blue | 9 |
| Red | 7 |
| Orange | 5 |
| Purple | 10 |
Draw the right flower. Write how many there are.
______ are the least in number. How many?
Answer the following question.
The number of people walking is more than the number of ______.
How many dots are there on the different faces of a die?
Rabia threw her die 30 times. She got  five times. In her table she marked:
Now fill in the table:
| Face of the die | Number of times ( / for each throw) |
 |
|
 |
|
 |
|
 |
|
 |
|
 |
Talk to people around you about their favourite sweets. Fill in the table:
| Favourite sweet | Number of people |
| Jalebi | |
Ask your friends about the number of people living in their homes. Fill in the table.
| Number of people living together | How many families |
| 1 alone | |
| 2 people | |
| 3 people | |
| 4 people | |
| 5 people | |
| 6 people | |
| 7 people | |
| 8 people | |
| ................. |
| Number of people living together | How many families |
| 1 alone | 2 |
| 2 people | 5 |
| 3 people | 8 |
| 4 people | 6 |
| 5 people | 4 |
| 6 people | 2 |
| 7 people | 2 |
| 8 people | 1 |
Most families have ______ people living in their homes.
Which vegetable is most disliked? Ask your friends and complete the table.
| Vegetable disliked | Number of students |
