Advertisements
Advertisements
प्रश्न
The following table gives the relation (obtained experimentally) between the time-period and the effective length of a pendulum. Illustrate the result by a broken line graph.
| Time-period (in sec) | 0.6 | 0.8 | 1.2 | 1.4 | 1.6 | 2.0 |
| Effective length (in cm) | 10 | 15 | 235 | 50 | 70 | 90 |
आलेख
Advertisements
उत्तर
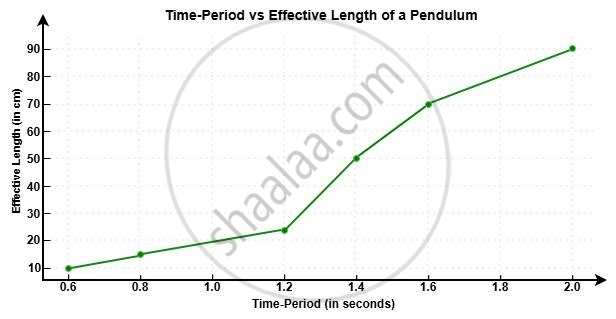
Here is the broken line graph representing the relationship between time-period and effective length of a pendulum.
The graph shows that as the time-period increases, the effective length also increases.
This visually supports the principle that the length of a pendulum is directly related to the square of its time-period.
shaalaa.com
या प्रश्नात किंवा उत्तरात काही त्रुटी आहे का?
