Advertisements
Advertisements
प्रश्न
The following table gives the number of first divisions obtained in various years by the students of a particular school. Illustrate them by a broken line graph.
| Year | 92-93 | 93-94 | 94-95 | 95-96 | 96-97 | 97-98 |
| No. of first divisions | 35 | 30 | 45 | 40 | 27 | 50 |
आलेख
Advertisements
उत्तर
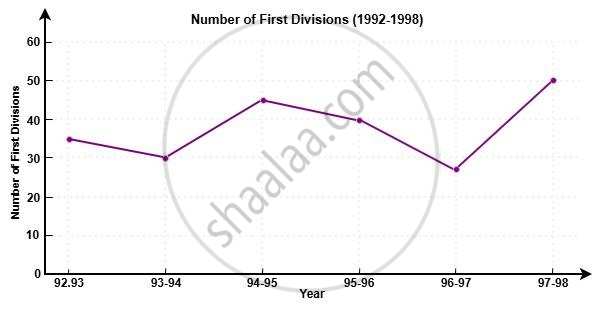
Here is the broken line graph showing the number of first divisions from the years 1992-93 to 1997-98.
The highest number of first divisions was in 1997-98 (50 students).
The lowest was in 1996-97 (27 students).
The line connects data points across years to show how the performance changed over time.
shaalaa.com
या प्रश्नात किंवा उत्तरात काही त्रुटी आहे का?
