Advertisements
Advertisements
प्रश्न
Give one example of ‘Rain Shadow’ areas in India.
Advertisements
उत्तर १
An example of a ‘Rain Shadow’ area in India is the Arabian Sea branch: Chennai lies on the leeward side of the Western Ghats and falls under the Rain Shadow.
उत्तर २
One example of a rain shadow area in India is the leeward side of the Western Ghats. The moisture-laden summer monsoon winds bring heavy rainfall to the windward side (the western side) of the Western Ghats, resulting in lush forests and high precipitation. However, these winds lose most of their moisture by the time they cross over the mountains, leaving the leeward (eastern) side dry with very little rainfall. This region often faces acute water shortages and sparse vegetation, making it a classic example of a rain shadow area in India.
संबंधित प्रश्न
Give reasons for the following:
When the Malabar Coast is receiving heavy rainfall in July, the Tamil Nadu coast is comparatively dry.
Study the data of distribution of temperature and rain for Station X and answer the questions that follow :
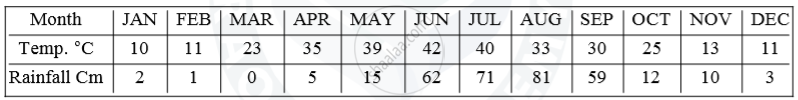
(i) Is Station X in the coastal area or in the interior of the country?
(ii) Calculate the total annual rainfall for Station X.
(iii) Name the wind that brings most of the rainfall to Station X.
State the climatic significance of the Himalayas to the people of South Asia.
Or
Describe the two ways in which the Himalayas influence the climate of India.
Mention why does Mumbai receive more rainfall than Pune.
Rajasthan receives very little rainfall.
Study the climatic data provided below and answer the questions that follow:
| Month | J | F | M | A | M | J | J | A | S | O | N | D |
| Station A | ||||||||||||
| Temp °C | 21.0 | 22.6 | 26.3 | 29.2 | 29.7 | 27.5 | 25.1 | 24.5 | 24.8 | 25.5 | 22.5 | 20.5 |
| Rain cm | 0.1 | 0.1 | 0.5 | 1.5 | 2.7 | 11.4 | 16.7 | 9.0 | 13.4 | 9.0 | 2.7 | 0.3 |
| Station B | ||||||||||||
| Temp °C | 24.4 | 24.4 | 26.7 | 28.3 | 30.0 | 28.9 | 27.2 | 27.2 | 27.2 | 28.3 | 27.2 | 25.0 |
| Rain cm | 0.2 | 0.3 | 0.3 | 1.7 | 1.9 | 50.2 | 61.0 | 37.0 | 27.0 | 4.8 | 1.4 | 0.3 |
(i) Calculate the annual range of temperature of Station B.
(ii) Calculate annual rainfall of Station A.
(iii) Presuming that both the stations are located in West India, state giving a reason as to which of the two lies on the windward side of the Western Ghats.
Given below is the climatic data of a station. Study the table and answer the questions that follow:
| Month | Jan. | Feb. | Mar. | Apr. | May | June | July | Aug. | Sep. | Oct. | Nov. | Dec. |
| Temperature °C | 24.5 | 25.7 | 27.7 | 20-4 | 30.0 | 32.5 | 31.0 | 30.2 | 29.8 | 28.0 | 25.9 | 24.7 |
| Rainfall cm | 4.6 | 1.3 | 1.3 | 1.8 | 3.8 | 4.5 | 8.7 | 11.3 | 11.9 | 30.6 | 35.0 | 13.9 |
- Calculate the annual rainfall experienced by the station.
- What is the annual range of temperature?
- Name the wettest month.
Given below is the climatic data of a station. Study the table and answer the questions that follow:
| Month | J | F | M | A | M | J | J | A | S | O | N | D |
| Temperature in Degree C. | 13.7 | 16.6 | 21.6 | 25.5 | 33.2 | 33.5 | 30.8 | 29.8 | 29.2 | 25.5 | 19.6 | 15.2 |
| Rainfall in cms. | 2.5 | 2.0 | 1.5 | 0.9 | 1.5 | 7.5 | 17.8 | 18.5 | 12.5 | 1.0 | 0.2 | 1.5 |
(i) Calculate the annual range of temperature.
(ii) What is the total rainfall experienced by the station?
(iii) Which is the driest month?
Give reason why Shillong gets hardly 200 cm., rainfall during the year, whereas Cherrapunji gets more than 1250 cm, of rainfall although they are situated very close to each other.
Name two types of cyclonic systems that affect India and two areas that receive rainfall from these systems.
