Advertisements
Advertisements
प्रश्न
Though Mangalore and Mysore are on the same latitude, Mangalore experiences more rainfall than Mysore. Give reasons.
Give a geographical reason for the following:
Mangalore experiences more rainfall than Mysore.
Advertisements
उत्तर
Mangalore experiences more rainfall than Mysore because Mangalore lies on windward side of Western Ghats and Mysore lies on leeward side of the Western Ghats.
संबंधित प्रश्न
How is the winter rainfall of the northwest part of India different from the winter rainfall of the southeast part of India?
Give a reason for each of the following:
Central Maharashtra gets less rainfall than the coastal area of Maharashtra.
Give a reason for each of the following:
The Summer Monsoon winds blow over the Arabian Sea from the South West.
Study the data of distribution of temperature and rain for Station X and answer the questions that follow :
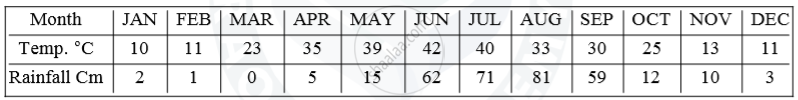
(i) Is Station X in the coastal area or in the interior of the country?
(ii) Calculate the total annual rainfall for Station X.
(iii) Name the wind that brings most of the rainfall to Station X.
Which parallel of latitude divides India into the northern and southern halves.
Mumbai receives rainfall in the summer season while Chennai receives rainfall from October to December. Why?
Rajasthan receives very little rainfall.
Given below is the climatic data of a station. Study the table and answer the questions that follow:
| Month | J | F | M | A | M | J | J | A | S | O | N | D |
| Temperature in Degree C. | 13.7 | 16.6 | 21.6 | 25.5 | 33.2 | 33.5 | 30.8 | 29.8 | 29.2 | 25.5 | 19.6 | 15.2 |
| Rainfall in cms. | 2.5 | 2.0 | 1.5 | 0.9 | 1.5 | 7.5 | 17.8 | 18.5 | 12.5 | 1.0 | 0.2 | 1.5 |
(i) Calculate the annual range of temperature.
(ii) What is the total rainfall experienced by the station?
(iii) Which is the driest month?
Name the winds which are responsible for heavy rainfall in India.
The average rainfall of India is about ______.
