Advertisements
Advertisements
प्रश्न
Draw the energy level diagram showing how the line spectra corresponding to Paschen series occur due to transition between energy levels.
Advertisements
उत्तर
For Paschen series, nf = 3 and ni = 4, 5, …
`1/lambda = R (1/3^2 -1/n_i^2 )`
Where, ni = 4, 5, …

APPEARS IN
संबंधित प्रश्न
Given the ground state energy E0 = - 13.6 eV and Bohr radius a0 = 0.53 Å. Find out how the de Broglie wavelength associated with the electron orbiting in the ground state would change when it jumps into the first excited state.
A 12.5 eV electron beam is used to bombard gaseous hydrogen at room temperature. Upto which energy level the hydrogen atoms would be excited? Calculate the wavelengths of the first member of Lyman and first member of Balmer series.
The total energy of an electron in the first excited state of the hydrogen atom is about −3.4 eV.
What is the potential energy of the electron in this state?
The total energy of an electron in the first excited state of the hydrogen atom is about −3.4 eV.
Which of the answers above would change if the choice of the zero of potential energy is changed?
Obtain the first Bohr’s radius and the ground state energy of a muonic hydrogen atom [i.e., an atom in which a negatively charged muon (μ−) of mass about 207 me orbits around a proton].
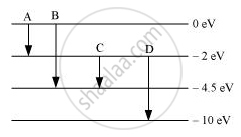
The energy levels of an atom are as shown below. Which of them will result in the transition of a photon of wavelength 275 nm?
Radiation coming from transitions n = 2 to n = 1 of hydrogen atoms fall on He+ ions in n = 1 and n = 2 states. The possible transition of helium ions as they absorb energy from the radiation is ______.
Which of the following is true for X-rays?
What is the energy of the atom when the electron jumps to the third orbit?
Which orbit number corresponds to the second excited state of hydrogen?
