Advertisements
Advertisements
प्रश्न
Divide:
\[- 4\ \text{by} \frac{- 3}{5}\]
बेरीज
Advertisements
उत्तर
\[ - 4 \div \frac{- 3}{5} = - 4 \times \frac{5}{- 3} = \frac{20}{3}\]
shaalaa.com
या प्रश्नात किंवा उत्तरात काही त्रुटी आहे का?
संबंधित प्रश्न
The sum of the two numbers is \[\frac{5}{9} .\] If one of the numbers is \[\frac{1}{3},\] find the other.
What should be added to \[\left( \frac{2}{3} + \frac{3}{5} \right)\] to get\[\frac{- 2}{15}?\]
Simplify:
\[\left( \frac{13}{7} \times \frac{11}{26} \right) - \left( \frac{- 4}{3} \times \frac{5}{6} \right)\]
Simplify:
\[\left( \frac{13}{9} \times \frac{- 15}{2} \right) + \left( \frac{7}{3} \times \frac{8}{5} \right) + \left( \frac{3}{5} \times \frac{1}{2} \right)\]
Fill in the blanks:
If a is reciprocal of b, then the reciprocal of b is .....
Divide:
\[5 \text{by} \frac{- 5}{7}\]
Write the following rational numbers in `p/q` form.
`3.bar17`
Write any three rational number between the two number given below.
0.3 and -0.5
Insert a rational number between:
3 and 4
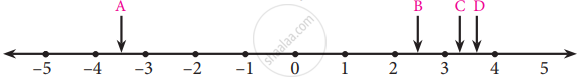
Which arrow best shows the position of `11/3` on the number line?