Advertisements
Advertisements
प्रश्न
Answer the following question in about 30 words:
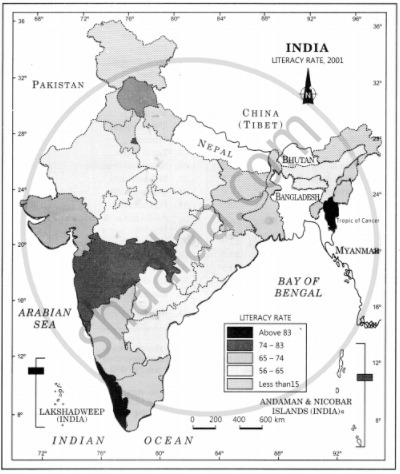
Describe and illustrate important steps to be followed in preparing a choropleth map.
अति संक्षिप्त उत्तर
Advertisements
उत्तर
The Choropleth maps are drawn to illustrate the characteristics of the data as they relate to the administrative units. These measures are used to represent the literacy rate, sex ratio, and population density.
Steps to be followed:
- Arrange the data in ascending or descending order.
- Group the data into 5 categories to represent very high, high, medium, low, and very low concentrations.
- The interval between the categories may be identified using the following formula: Range/5, where Range = maximum value – minimum value.
- Patterns, shades, or colours to be used to depict the chosen categories should be marked in an increasing or decreasing order.
| Original Data on Literacy in India | ||
| SI.No. | States/Union territories | Literacy Rate |
| 1. | Jammu 8s Kashmir | 55.5 |
| 2. | Himachal Pradesh | 76.5 |
| 3. | Punjab | 69.7 |
| 4. | Chandigarh | 81.9 |
| 5. | Uttarakhand | 71.6 |
| 6. | Haryana | 67.9 |
| 7. | Delhi | 81.7 |
| 8. | Rajasthan | 60.4 |
| 9. | Uttar Pradesh | 56.3 |
| 10. | Bihar | 47.0 |
| 11. | Sikkim | 68.8 |
| 12. | Arunachal Pradesh | 54.3 |
| 13. | Nagaland | 66.6 |
| 14. | Manipur | 70.5 |
| 15. | Mizoram | 88.8 |
| 16. | Tripura | 73.2 |
| 17. | Meghalaya | 62.6 |
| 18. | Assam | 63.3 |
| 19. | West Bengal | 68.6 |
| 20. | Jharkhand | 53.6 |
| 21. | Odisha | 63.1 |
| 22. | Chhattisgarh | 64.7 |
| 23. | Madhya Pradesh | 63.7 |
| 24. | Gujarat | 69.1 |
| 25. | Daman & Diu | 78.2 |
| 26. | Dadra 8s Nagar Haveli | 57.6 |
| 27. | Maharashtra | 76.9 |
| 28. | Andhra Pradesh | 60.5 |
| 29. | Karnataka | 66.6 |
| 30. | Goa | 82.0 |
| 31. | Lakshadweep | 86.7 |
| 32. | Kerala | 90.9 |
| 33. | Tamil Nadu | 73.5 |
| 34. | Puducherry | 81.2 |
| 35. | Andaman & Nicobar Islands | 81.3 |
| Original Data on Literacy in India | ||
| SI.No. | States/Union territories | Literacy Rate |
| 10. | Bihar | 47.0 |
| 20. | Jharkhand | 53.6 |
| 12. | Arunachal Pradesh | 54.3 |
| 01. | Jammu 8s Kashmir | 55.5 |
| 9. | Uttar Pradesh | 56.3 |
| 26. | Dadra 8s Nagar Haveli | 57.6 |
| 08. | Rajasthan | 60.4 |
| 28. | Andhra Pradesh | 60.5 |
| 17. | Meghalaya | 62.6 |
| 21. | Odisha | 63.1 |
| 18. | Assam | 63.3 |
| 23. | Madhya Pradesh | 63.7 |
| 22. | Chhattisgarh | 64.7 |
| 13. | Nagaland | 66.6 |
| 29. | Karnataka | 66.6 |
| 06: | Haryana | 67.9 |
| 19. | West Bengal | 68.6 |
| 11. | Sikkim | 68.8 |
| 24. | Gujarat | 69.1 |
| 03. | Punjab | 69.7 |
| 14. | Manipur | 70.5 |
| 05. | Uttarakhand | 71.6 |
| 16. | Tripura | 73.2 |
| 33. | Tamil Nadu | 73.5 |
| 02. | Himachal Pradesh | 76.5 |
| 27. | Maharashtra | 76.9 |
| 25. | Daman & Diu | 78.2 |
| 34. | Puducherry | 81.2 |
| 35. | Andaman & Nicobar Islands | 81.3 |
| 07. | Delhi | 81.7 |
| 04. | Chandigarh | 81.9 |
| 30. | Goa | 82.0 |
| 31. | Lakshadweep | 86.7 |
| 15. | Mizoram | 88.8 |
| 32. | Kerala |
90.9 |
Construction:
- Arrange the data in ascending order as shown above.
- Identify the range within the data. The states recording the lowest and highest literacy rates are Bihar (47%) and Kerala (90.9%), respectively. Hence, the range would be 91.0 – 47.0 = 44.0.
- Divide the range by 5 to get categories from very low to very high. (44.0/ 5 = 8.80. We can convert this value to a round number, say 9.0.
- Determine the number of categories and the range for each category. Add 9.0 to the lowest value of 47.0, and so on.
The following categories will be obtained:
- 47 – 56
Very low (Bihar, Jharkhand, Arunachal Pradesh, Jammu and Kashmir) - 56 – 65
Low (Uttar Pradesh, Rajasthan, Andhra Pradesh, Meghalaya,
Odisha, Assam, Madhya Pradesh, Chhattisgarh) - 65 – 74
Medium (Nagaland, Karnataka, Haryana, West Bengal, Sikkim, Gujarat, Punjab, Manipur, Uttarakhand, Tripura, Tamil Nadu) - 74 – 83
High (Himachal Pradesh, Maharashtra, Delhi, Goa) - 83 – 92
Very High (Mizoram, Kerala)
Assign the shades/patterns to each category, ranging from lower to higher hues
shaalaa.com
Classification of Thematic Maps Based on Method of Construction
या प्रश्नात किंवा उत्तरात काही त्रुटी आहे का?
पाठ 3: Graphical Representation of Data - Exercises [पृष्ठ ४४]
