Advertisements
Advertisements
प्रश्न
A machine is set to deliver packets of a given weight. Ten samples of size five each were recorded. Below are given relevant data:
| Sample number | 1 | 2 | 3 | 4 | 5 | 6 | 7 | 8 | 9 | 10 |
| `bar"X"` | 15 | 17 | 15 | 18 | 17 | 14 | 18 | 15 | 1 | 16 |
| R | 7 | 7 | 4 | 9 | 8 | 7 | 12 | 4 | 11 | 5 |
Calculate the control limits for mean chart and the range chart and then comment on the state of control, (conversion factors for n = 5, A2 = 0.58, D3 = 0 and D4 = 2.115)
Advertisements
उत्तर
| Sample number | 1 | 2 | 3 | 4 | 5 | 6 | 7 | 8 | 9 | 10 | Tota |
| Mean `(bar"X")` | 15 | 17 | 15 | 18 | 17 | 14 | 18 | 15 | 1 | 16 | `sum"X"` = 162 |
| Range (R) | 7 | 7 | 4 | 9 | 8 | 7 | 12 | 4 | 11 | 5 | `sum"R"` = 74 |
The control limits for `bar"X"` chart is
`\overset{==}{"X"} = (sum"X")/"No. of samples" = 162/10` = 16.2
`bar"R" = (sum"R")/"No. of samples" = 74/10` = 7.4
UCL = `\overset{==}{"X"} + "A"_2+ bar"R"`
= 16.2 + (0.58)(7.4)
= 16.2 + 4.292
= 20.492
= 20.49
CL = `\overset{=}{"X"}` = 16.2
LCL = `\overset{==}{"X"} - "A"_2 bar"R"`
= 16.2 – (0.58)(7.4)
= 16.2 – 4.292
= 11.908
= 11.91
The control limits for Range chart is
CL = `"D"_4bar"R"`
= (2.115)(7.4)
= 15.651
= 15.65
CL = `bar"R"` = 7.4
LCL = `"D"_3 bar"R"` = (0)(7.4) = 0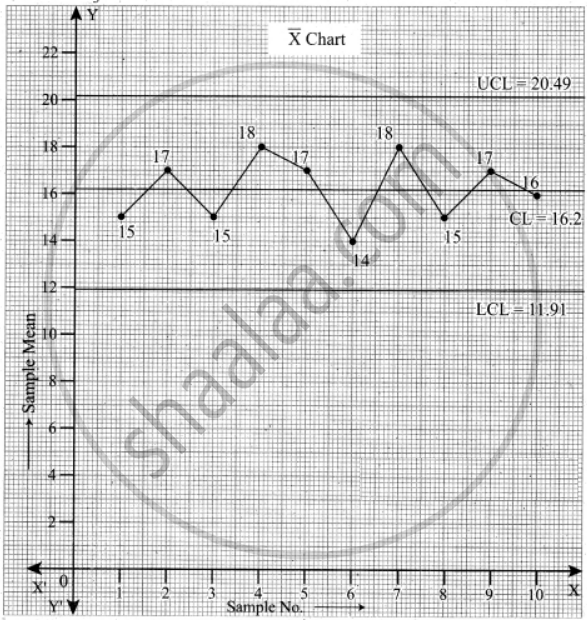
The above diagram shows all the three control lines with the data points plotted.
We see that all the points of the sample mean are within the control limits.
We now draw the R chart for the given data.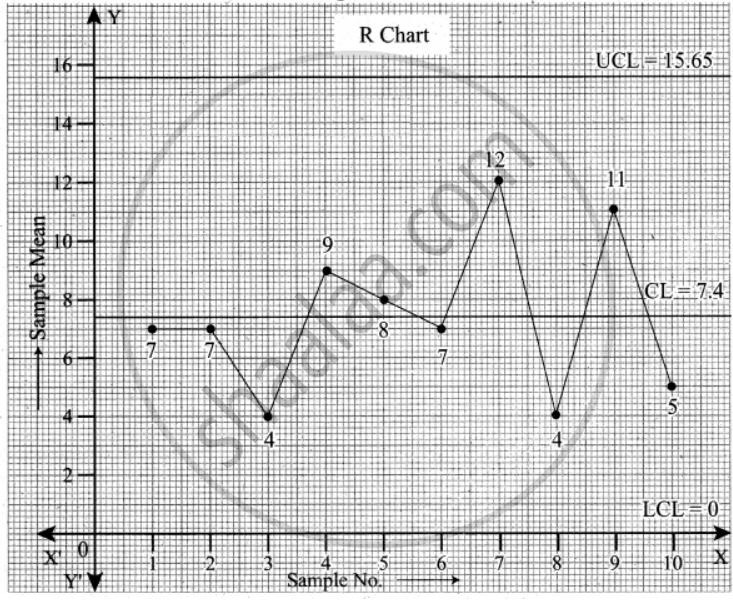
The above diagram shows all the three control lines with the sample range points plotted.
We observe that all the points are within the control limits.
Conclusion: From the above two plots of the sample mean `bar"X"` and sample range R, we conclude that the process is in control.
APPEARS IN
संबंधित प्रश्न
Define chance cause
What do you mean by process control?
Write the control limits for the mean chart
Ten samples each of size five are drawn at regular intervals from a manufacturing process. The sample means `(bar"X")` and their ranges (R) are given below:
| Sample number | 1 | 2 | 3 | 4 | 5 | 6 | 7 | 8 | 9 | 10 |
| `bar"X"` | 49 | 45 | 48 | 53 | 39 | 47 | 46 | 39 | 51 | 45 |
| R | 7 | 5 | 7 | 9 | 5 | 8 | 8 | 6 | 7 | 6 |
Calculate the control limits in respect of `bar"X"` chart. (Given A2 = 0.58, D3 = 0 and D4 = 2.115) Comment on the state of control
In a production process, eight samples of size 4 are collected and their means and ranges are given below. Construct mean chart and range chart with control limits.
| Samples number | 1 | 2 | 3 | 4 | 5 | 6 | 7 | 8 |
| `bar"X"` | 12 | 13 | 11 | 12 | 14 | 13 | 16 | 15 |
| R | 2 | 5 | 4 | 2 | 3 | 2 | 4 | 3 |
Choose the correct alternative:
Variations due to natural disorder is known as
Choose the correct alternative:
A typical control charts consists of
Choose the correct alternative:
`bar"X"` chart is a
Choose the correct alternative:
R is calculated using
From the following data, calculate the control limits for the mean and range chart.
| Sample No. | 1 | 2 | 3 | 4 | 5 | 6 | 7 | 8 | 9 | 10 |
| Sample Observations |
50 | 21 | 50 | 48 | 46 | 55 | 45 | 50 | 47 | 56 |
| 55 | 50 | 53 | 53 | 50 | 51 | 48 | 56 | 53 | 53 | |
| 52 | 53 | 48 | 50 | 44 | 56 | 53 | 54 | 549 | 55 | |
| 49 | 50 | 52 | 51 | 48 | 47 | 48 | 53 | 52 | 54 | |
| 54 | 46 | 47 | 53 | 47 | 51 | 51 | 47 | 54 | 52 |
