Advertisements
Advertisements
प्रश्न
Verbal to Non-Verbal:
Read the following information and complete the following table below it:
Chandrayaan-2, India’s second mission to the Moon will, for the first time, unravel secrets around the Moon’s the South Pole. Chandrayaan-2 is a three-part spacecraft - an orbiter, a lander, and a rover. The lander is named Vikram after Vikram Sarabhai, the founder of the Indian space programme. The rover is named Pragyan, meaning ‘wisdom’.
Chandrayaan-2 was launched on 22 July atop ISRO’s GSLV Mk-III at 2:43 p.m. from the Satish Dhawan Space Centre at Sriharikota. Performing as expected, the rocket released Chandrayaan-2 in a highly elliptic orbit around Earth about 17 minutes later. In fact, it was released 6,000 km higher than planned. The solar arrays on Chandrayaan-2 deployed smoothly as the probe began its journey.
| Table | Information | |
| 1. | Name of the Mission | |
| 2. | Date of Launch | |
| 3. | Centre of Launch | |
| 4 | Name of the Rover | |
| 5. | Founder of Indian Space Programme |
Advertisements
उत्तर
Facts about Chandrayaan-2
| Table | Information | |
| 1. | Name of the Mission | Chandrayaan-2 |
| 2. | Date of Launch | 22 July |
| 3. | Centre of Launch | Satish Dhawan Space Centre at Shriharikota |
| 4. | Name of the Rover | Pragyan meaning ‘wisdom’ |
| 5. | Founder of Indian Space Programme | Vikram Sarabhai |
APPEARS IN
संबंधित प्रश्न
Read the following extract and complete the table given below :
Computer Assisted Language Leaming (CALL) materials come in two main formats: CD/DVD RO Ms and Web-based. Some are tailored to the content to be used in the classrooms whereas others can be used independently. CALL materials allow you to work at your own pace.
Multimedia materials offer you the opportunity to take part in other computer-assisted activities, such as text-based gap-filling, multiple-choice and text reconstruction activities. Language teachers often develop such text-based CALL activities to accompany a particular course. CALL materials can be regularly updated.
Because CALL learning activity types are usually designed from a template, they can sometimes be repetitive.
A major advantage of CALL materials is that they offer instant feedback on your spoken or written performance. However, such feedback can be limited. If you are more interested in creating your own responses or elaborating on your ideas, you may find this type of Facebook frustrating. Web-based CALL materials can offer more variety through the use of hyperlinks, but feedback is still limited.
Just as representations of the cultures of the target language offered by courses using books; audio and videotapes can perpetuate stereotypes.
| Computer Assisted Language Learning Material | ||
| Formats | Advantages | Disadvantages |
| ------------and Web-based | (a) content tailored for classroom use |
(i) ------- |
| (b) ----------- | (ii) limited feedback | |
| (c) ----------- | (iii) --------- | |
| (d) offer opportunity to take part in other computer-assisted activities | (iv)-------- | |
| (e) ----------- | ||
| (f) ----------- | ||
| (g) offer variety | ||
|
Courses
|
Intake capacity
|
Vacant seats
|
|
Engineering:
|
||
|
Degree
|
1, 55, 102
|
42, 497
|
|
Diploma
|
1, 65, 413
|
55, 107
|
|
Post - graduation
|
13, 651
|
1, 810
|
|
Pharmacy:
|
||
|
Degree
|
9, 712
|
924
|
|
Diploma
|
12, 959
|
1, 771
|
|
Post - graduation
|
5, 296
|
3, 506
|
A survey was conducted among the teachers of New Hope High School to find out whether Class X students should be allowed to use mobile phones in the campus. The results of the survey are shown in the pie-chart below.
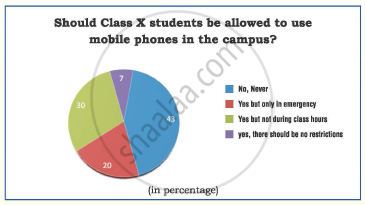
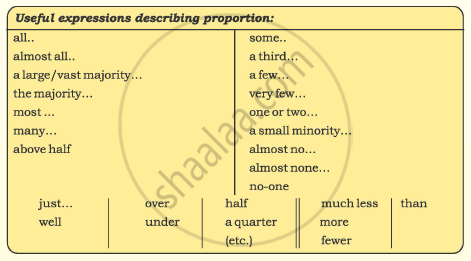
Look at the pie chart and the useful expressions above. Fill in the gaps in the following summary of results.
As can be seen from the above pie-chart, nearly a__________ of the teachers felt that Class X students must not be allowed to use mobile phones in the school campus. However, nearly one____________ believed
the phones should be permitted but not during class hours. About __________were of the opinion that the students may be allowed to use these phones only in times of emergency while a very__________ did not favour any restrictions on their use in the campus.
Do anyone of the following activities.
Transfer the given information into a paragraph.
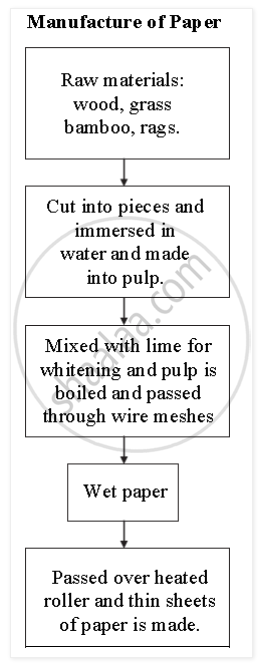
Verbal to Non-Verbal
Read the following information and complete the table given below:
| Basically industries are broadly classified on the basis of raw material, the scale of production and the volume of investment made. Further they are classified as per the source of raw material, example, agro-based industries such as sugar, cotton, etc. Forest based such as paper, lac, and mineral based such as iron, steel and chemicals, etc. The scale of the production determines whether they are small scales, such as food processing, leather goods, etc., or large scale, automobile, shipbuilding, etc. Similarly, there are industries which are set up by the government, called Public Sector. Those industries which are set up by the Private entrepreneur are called Private Sector and those which are run collectively by a group of people are called Co-operative Sector. |
| Table | Information |
| (1) Examples of forest-based industries. | |
| (2) Examples of small scale industries. | |
| (3) Examples of large scale industries. | |
| (4) Industries setup by private entrepreneur. | |
| (5) Industries run by a group of people. |
Verbal to Non-verbal
Read the information from the given paragraph and write it into a tree diagram.
| There are different kinds of musical instruments. They are divided into three main classes according to the way that they are played. Some instruments are played by blowing air into them. These are called wind instruments. Some of these are said to be of the wood wind family. Examples of woodwind instruments are the flute, the clarinet and the horn. There are also various other wind instruments such as the mouth organ and the bagpipes. Some instruments are played by banging or striking them. Instruments like this are called percussion instruments. The last big group of musical instruments have strings. There are two kinds of stringed instruments. Examples are the harp and the guitar, the violin and the cello. |
Non-Verbal to Verbal:
Write the given information in the form of a paragraph:
Distribution of working children by type of work in 2011
| Area of work | Percentage | Number (in millions) |
| Cultivators | 26.0 | 2.63 |
| Agricultural labourers | 32.9 | 3.33 |
| Household workers | 5.2 | 0.52 |
| Other workers | 35.8 | 3.62 |
Given below is a web diagram containing information about the different means of electronic devices of entertainment-some audio, some visual and some audio-visual.
Write a short paragraph based on information from the web. Give a suitable title to it.

Non-verbal to verbal:
Read the information given in the following tree-diagram and write two short paragraphs based on it. Give a suitable title to your write up:
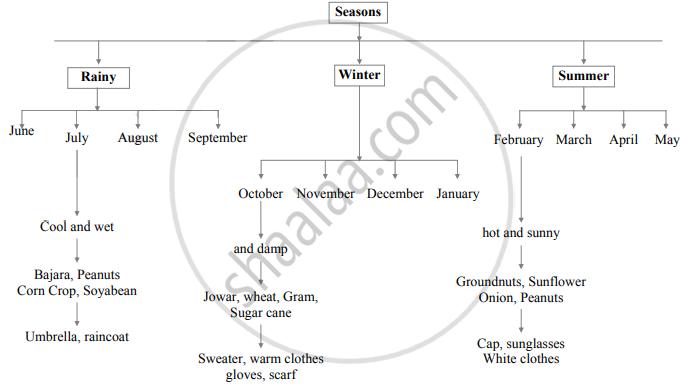
Verbal to Non-verbal:
Read the following information and complete the given table below. Suggest a suitable title to it:
|
Chandrayaan-1 was India's first mission to the moon. It launched on Oct. 22, 2008 from the Satish Dhawan Space Centre in Sriharikota, India. Its scientific goals are to study the chemical, mineralogical and photogeological mapping of the moon. In addition to find out water on the moon. Then to perform high resolution remote sensing of the moon’s surface. The Chandrayaan-2 mission was successfully launched on 22nd July, 2019 from Satish Dhawan Space Centre, Sriharikota. The primary objectives were to demonstrate the ability to soft land and operate a robotic rover on the lunar surface. The mission was arranged to study the lunar topography, mineralogy, elemental abundance and the lunar ecosphere, conduct a detailed search for water and ice in polar region. Chandrayaan 2’s objectives are to find Chandrayaan-1 as reported by the ISRO. The mission targeted the “South Polar region” of the moon which was completely unexplored. The mission focused on the extensive mapping of the lunar surface for studying variations in its composition and tracing the moon's origin and evolution. Chandrayaan-3 launched to the moon on July 14, 2023 from the Satish Dhawan Space Centre in Sriharikota, India, the medium-life launch vehicle Mark-III (LVM3) rocket. The three main objectives of Chandrayaan-3 are to land safely on the surface, to demonstrate rover operations and to perform scientific experiments on site, according to the official website. |
Title: __________________
| Name of Chandrayaan | Date of launching | Objectives of Mission |
| Chandrayaan-1 | ||
| Chandrayaan-2 | ||
| Chandrayaan-3 |
