हिंदी

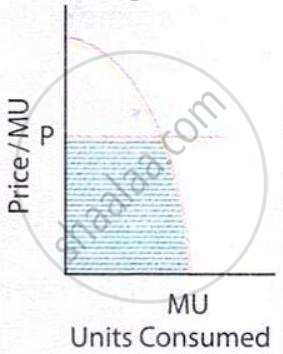
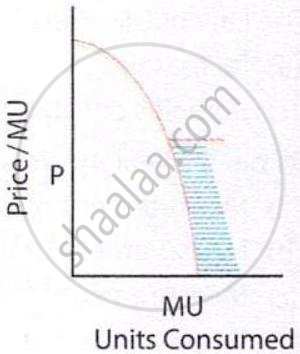
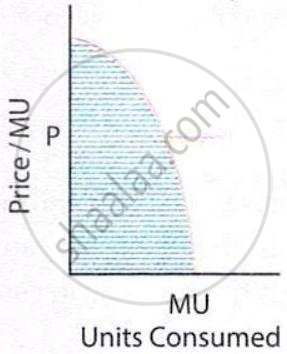
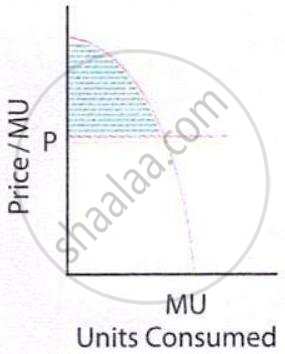
Which of the shaded area in the diagrams below represent total utility?

Advertisements
Advertisements

प्रश्न

Which of the shaded area in the diagrams below represent total utility?

विकल्प
  • MU Units Consumed curve

  • MU Units Consumed curve

  • MU Units Consumed curve

  • MU Units Consumed

MCQ
Advertisements

उत्तर

MU Units Consumed curve

Explanation:

Total utility is represented by the area under the marginal utility curve up to the quantity consumed. The third diagram shows that shaded area.

shaalaa.com
  क्या इस प्रश्न या उत्तर में कोई त्रुटि है?
अध्याय 2: Consumer's Equilibrium - OBJECTIVE QUESTIONS [पृष्ठ २.५०]

APPEARS IN

संदीप गर्ग Introductory Microeconomics [English] Class 11
अध्याय 2 Consumer's Equilibrium
OBJECTIVE QUESTIONS | Q 46. | पृष्ठ २.५०
Share
Notifications

Englishहिंदीमराठी


      Forgot password?
Use app×