Advertisements
Advertisements
प्रश्न
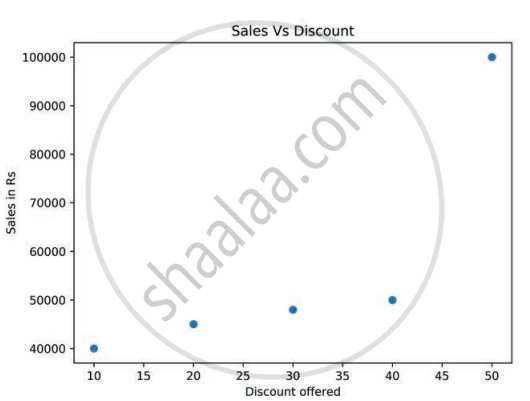
What value does each bubble on the plot in the figure represent?
दीर्घउत्तर
Advertisements
उत्तर
Each bubble (or dot) on this scatter plot represents a pair of values showing the relationship between a specific discount and its resulting sales:
- On the X-axis: The discount offered.
- On the Y-axis: The corresponding sales in Rs achieved at that discount level.
Exact Values Represented by the 5 Bubbles:
- Bubble 1: 10% Discount → ₹40,000 Sales
- Bubble 2: 20% Discount → ₹45,000 Sales
- Bubble 3: 30% Discount → ₹48,000 Sales
- Bubble 4: 40% Discount → ₹50,000 Sales
- Bubble 5: 50% Discount → ₹100,000 Sales
shaalaa.com
क्या इस प्रश्न या उत्तर में कोई त्रुटि है?
