Advertisements
Advertisements
प्रश्न
Visit data.gov.in, search for the following in “catalogs” option of the website:
- Final population Totals, India and states
- State-wise literacy rate
Download them and create a CSV file containing population data and literacy rate of the respective state. Also add a column Region to the CSV file that should contain the values East, West, North and South. Plot a scatter plot for each region where X axis should be population and Y axis should be Literacy rate. Change the marker to a diamond and size as the square root of the literacy rate.
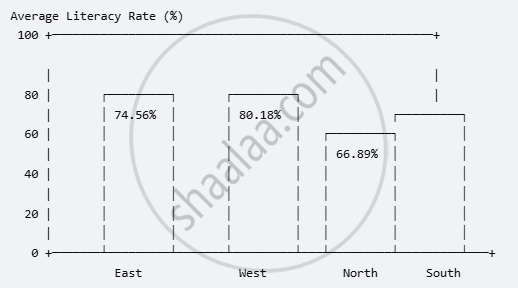
Group the data on the column region and display a bar chart depicting average literacy rate for each region.
लघु उत्तरीय
Advertisements
उत्तर
| State | Population | Literacy Rate | Region |
| Uttar Pradesh | 199812341 | 67.68 | North |
| Rajasthan | 68548437 | 66.11 | North |
| Maharashtra | 112374333 | 82.34 | West |
| Gujarat | 60439692 | 78.03 | West |
| West Bengal | 91276115 | 76.26 | East |
| Odisha | 41974218 | 72.87 | East |
| Tamil Nadu | 72147030 | 80.09 | South |
| Kerala | 33406061 | 93.91 | South |
Bar Chart
Title: Average Literacy Rate of Each Region
| Region | Average Literacy Rate |
| East | 74.56% |
| West | 80.18% |
| North | 66.89% |
| South | 87.00% |
shaalaa.com
क्या इस प्रश्न या उत्तर में कोई त्रुटि है?
