Advertisements
Advertisements
प्रश्न
The sales of a commodity in tones varied from January 2010 to December 2010 as follows:
| In Year 2010 | Sales (in tones) |
| Jan | 280 |
| Feb | 240 |
| Mar | 270 |
| Apr | 300 |
| May | 280 |
| Jun | 290 |
| Jul | 210 |
| Aug | 200 |
| Sep | 230 |
| Oct | 200 |
| Nov | 230 |
| Dec | 210 |
Fit a trend line by the method of semi-average
Advertisements
उत्तर
Since the number of months is even (12), we can equally divide the given data into two equal parts and obtain the averages of the first six months and last six months
| In Year 2010 |
Sales (in tones) |
Average |
| Jan | 280 | `(280 + 240 + 270 + 300 + 280 + 290)/6` = 276.667 |
| Feb | 240 | |
| Mar | 270 | |
| Apr | 300 | |
| May | 280 | |
| Jun | 290 | |
| Jul | 210 | `(210 + 200 + 230 + 200 + 230 + 210)/6` = 213.33 |
| Aug | 200 | |
| Sep | 230 | |
| Oct | 200 | |
| Nov | 230 | |
| Dec | 210 |
Thus we obtain semi-average I = 276.667 and semi-average II = 213.333
To fit a trend line we plot each value at the mid-point (month) of each half.
i.e we plot 276.667 in the middle of March and April
we plot 213.333 in the middle of September and October.
We join the two points by a straight line.
This is the required line.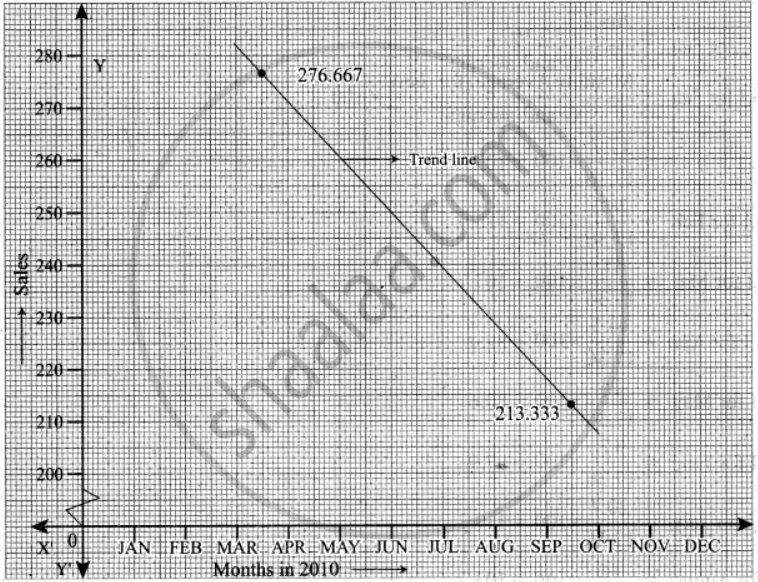
APPEARS IN
संबंधित प्रश्न
What is the need for studying time series?
Mention the components of the time series
Find the trend of production by the method of a five-yearly period of moving average for the following data:
| Year | Production ('000) |
| 1979 | 126 |
| 1980 | 123 |
| 1981 | 117 |
| 1982 | 128 |
| 1983 | 125 |
| 1984 | 124 |
| 1985 | 130 |
| 1986 | 114 |
| 1987 | 122 |
| 1988 | 129 |
| 1989 | 118 |
| 1990 | 123 |
Determine the equation of a straight line which best fits the following data
| Year | 2000 | 2001 | 2002 | 2003 | 2004 |
| Sales (₹ '000) | 35 | 36 | 79 | 80 | 40 |
Compute the trend values for all years from 2000 to 2004
Use the method of monthly averages to find the monthly indices for the following data of production of a commodity for the years 2002, 2003 and 2004
| 2002 | 2003 | 2004 |
| 15 | 20 | 18 |
| 18 | 18 | 25 |
| 17 | 16 | 21 |
| 19 | 13 | 11 |
| 16 | 12 | 14 |
| 20 | 15 | 16 |
| 21 | 22 | 19 |
| 18 | 16 | 20 |
| 17 | 18 | 1 |
| 15 | 20 | 16 |
| 14 | 17 | 18 |
| 18 | 15 | 20 |
Choose the correct alternative:
The seasonal variation means the variations occurring with in
A bullet of mass m and velocity a is fired into a large block of wood of mass M The final velocity of the system is
The sum of the series `log_4 2 - log_8 2 + log_16 2 + ...............` to `oo` is
Let An be the sum of the first n terms of the geometric series `704 + 704/2 + 704/4 + 704/8 + ...` and Bn be the sum of the first n terms of the geometric series `1984 - 1984/2 + 1984/4 + 1984/8 + ...` If An = Bn, then the value ofn is (where n ∈ N).
Sum of the first n terms of the series `1/2 + 3/4 + 7/8 + 15/16 +`......... is equal to:
