Advertisements
Advertisements
प्रश्न
The following table shows the number of Buses and Trucks in nearest lakh units. Draw percentage bar-diagram. (Approximate the percentages to the nearest integer)
| Year | No of trucks | No of buses |
| 2005-2006 2007-2008 2008-2009 2009-2010 |
47 56 60 63 |
9 13 16 18 |
आलेख
Advertisements
उत्तर
The following table shows the number of Buses and Trucks in nearest lakh units.
| Year | No of trucks | Percentage of trucks | No of buses | Percentage of buses |
| 2005-2006 | 47 | =47(47+9)×100=470056=83.92≈84 | 9 | =9(47+9)×100=90056=16.07≈16 |
| 2007-2008 | 56 | =56(56+13)×100=560069=81.15≈81 | 13 | =13(56+13)×100=130069=18.84≈19 |
| 2008-2009 | 60 | =60(60+16)×100=600076=78.94≈79 | 16 | =16(60+16)×100=160076=21.05≈21 |
| 2009-2010 | 63 | =63(63+18)×100=630081=77.77≈78 | 18 | =18(63+18)×100=180081=22.22≈22 |
The percentage bar-diagram of the above table is as follows: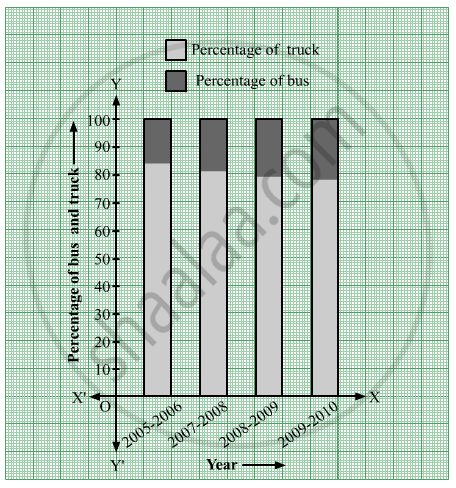
shaalaa.com
क्या इस प्रश्न या उत्तर में कोई त्रुटि है?
