हिंदी

The following diagram represents ______ elastic demand for commodity X.

Advertisements
Advertisements

प्रश्न

The following diagram represents ______ elastic demand for commodity X.
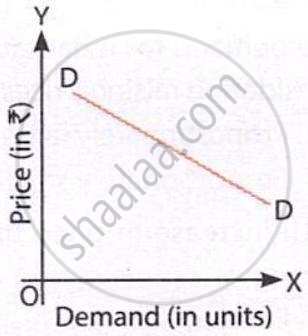
The diagram shows a downward-sloping demand curve DD, indicating an inverse relationship between price and quantity demanded. As price falls, quantity demanded increases.

विकल्प

  • Less

  • Highly

  • Unitary

  • Perfectly

MCQ
रिक्त स्थान भरें
Advertisements

उत्तर

The following diagram represents highly elastic demand for commodity X.

The diagram shows a downward-sloping demand curve DD, indicating an inverse relationship between price and quantity demanded. As price falls, quantity demanded increases.

Explanation:

The diagram represents a relatively flat downward-sloping demand curve, indicating highly elastic demand. A vertical curve would be perfectly inelastic, while a horizontal curve would be perfectly elastic.

shaalaa.com
  क्या इस प्रश्न या उत्तर में कोई त्रुटि है?
अध्याय 4: Elasticity of Demand - OBJECTIVE QUESTIONS [पृष्ठ ४.३७]

APPEARS IN

संदीप गर्ग Introductory Microeconomics [English] Class 11
अध्याय 4 Elasticity of Demand
OBJECTIVE QUESTIONS | Q 7. | पृष्ठ ४.३७
Share
Notifications

Englishहिंदीमराठी


      Forgot password?
Use app×