Advertisements
Advertisements
प्रश्न
The data on modes of transport used by the students to come to school are given below. Draw a pie chart for the data
| Mode of transport | Bus | Cycle | Walking | Scooter | Car |
| Percentage of students | 40% | 30% | 15% | 10% | 5% |
सारिणी
आकृति
Advertisements
उत्तर
Converting the percentage into components parts of 360°. we have
| Mode of Transport | Percentage of students | Central angle |
| Bus | 40% | `40/100 xx 360^circ` = 114° |
| Cycle | 30% | `30/100 xx 360^circ` = 108° |
| Walking | 15% | `15/100 xx 360^circ` = 54° |
| Scooter | 10% | `10/100 xx 360^circ` = 36° |
| Car | 5% | `5/100 xx 360^circ` = 18° |
| Total | 100% | 360° |
Mode of Transport by students.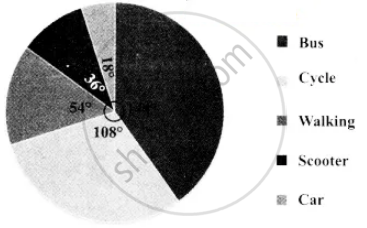
shaalaa.com
क्या इस प्रश्न या उत्तर में कोई त्रुटि है?
