Advertisements
Advertisements
प्रश्न
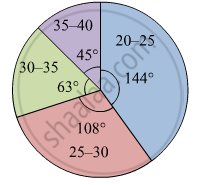
The age group and number of persons, who donated blood in a blood donation camp is given below. Draw a pie diagram from it.
|
Age group (Yrs) |
20 - 25 |
25 - 30 |
30 - 35 |
35 - 40 |
|
No. of persons |
80 |
60 |
35 |
25 |
सारिणी
Advertisements
उत्तर
The measures of central angles are given in the table.
| Age group (Yrs) | No. of persons | Central Angle |
| 20 - 25 | 80 | \[\frac{80}{200} \times 360 = 144^\circ\] |
| 25 - 30 | 60 | \[\frac{60}{200} \times 360 = 108^\circ\] |
| 30 - 35 | 35 | \[\frac{35}{200} \times 360 = 63^\circ\] |
| 35 - 40 | 25 | \[\frac{25}{200} \times 360 = 45^\circ\] |
| Total | 200 | 360° |
The pie diagram showing the above data is given below:
shaalaa.com
क्या इस प्रश्न या उत्तर में कोई त्रुटि है?
