Advertisements
Advertisements
प्रश्न
Taking 0.5 cm as 1 unit, plot the following points on the graph paper:
A(1, 3), B(– 3, – 1), C(1, – 4), D(– 2, 3), E(0, – 8), F(1, 0)
Advertisements
उत्तर
Here, in point A(1, 3) both x and y-coordinates are positive, so it lies in I quadrant.
In point B(– 3, – 1), both x and y-coordinates are negative, so it lies in III quadrant.
In point C(1, – 4), x-coordinate is positive and y-coordinate is negative, so it lies in IV quadrant.
In point D(– 2, 3), x-coordinate is negative and y-coordinate is positive, so it lies in II quadrant.
In point E(0, – 8) x-coordinate is zero, so it lies on y-axis and in point F(1, 0) y-coordinate is zero, so it lies on x-axis.

APPEARS IN
संबंधित प्रश्न
Plot the following point on the graph paper:
(7, −4)
Plot the following point on the graph paper:
(−3, 2)
On plotting the points O(0, 0), A(3, 0), B(3, 4), C(0, 4) and joining OA, AB, BC and CO which of the following figure is obtained?
Find the quadrants without plotting the point on a graph sheet.
(5, 7)
Find the quadrants without plotting the point on a graph sheet
(−7, 2)
Find the quadrants without plotting the point on a graph sheet.
(0, 10)
If P(–1, 1), Q(3, –4), R(1, –1), S(–2, –3) and T(–4, 4) are plotted on the graph paper, then the point(s) in the fourth quadrant are ______.
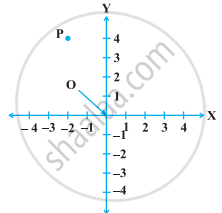
In the following figure, coordinates of P are ______.
Plot the points (x, y) given by the following table:
| x | 2 | 4 | – 3 | – 2 | 3 | 0 |
| y | 4 | 2 | 0 | 5 | – 3 | 0 |
Plot the following points and check whether they are collinear or not:
(0, 0), (2, 2), (5, 5)
