Advertisements
Advertisements
प्रश्न
Srikanth is a class IX Mathematics teacher in Chennai. After a class test, he asks a student to record the marks that all the students obtained. Narayanan scored the least marks 6 in the class and Keerthana scored the highest marks 59 in the class out of 60 marks. He prepares a frequency distribution table using the collected data and draws a histogram as shown below:
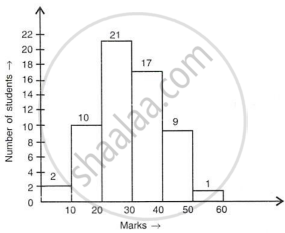
- What is the width of each class?
- What is the total number of students in class IX?
- How many students scored 50% and above marks?
- What is the range of the collected data?
मामले का अध्ययन
Advertisements
उत्तर
Histogram data representing student marks with class intervals (0-10, 10-20, 20-30, 30-40, 40-50, 50-60) and respective frequencies (2, 10, 21, 17, 9, 1), with the lowest mark being 6 and the highest being 59.
- Width of each class:
Width = Upper Limit − Lower Limit = 10 − 0 = 10 [Subtracting the lower limit from the upper limit of the first interval] - Total number of students:
Total Students = 2 + 10 + 21 + 17 + 9 + 1 = 60 [Summing the frequencies of all class intervals] - Students scoring 50% and above marks:
Passing Mark (50% of 60) = 30 [Calculating half of the maximum possible test marks]
Total Students = 17 + 9 + 1 = 27 [Adding frequencies of classes 30-40, 40-50, and 50-60] - Range of the collected data:
Range = Highest Value − Lowest Value = 59 − 6 = 53 [Subtracting the lowest score from the highest score]
shaalaa.com
क्या इस प्रश्न या उत्तर में कोई त्रुटि है?
