Advertisements
Advertisements
प्रश्न
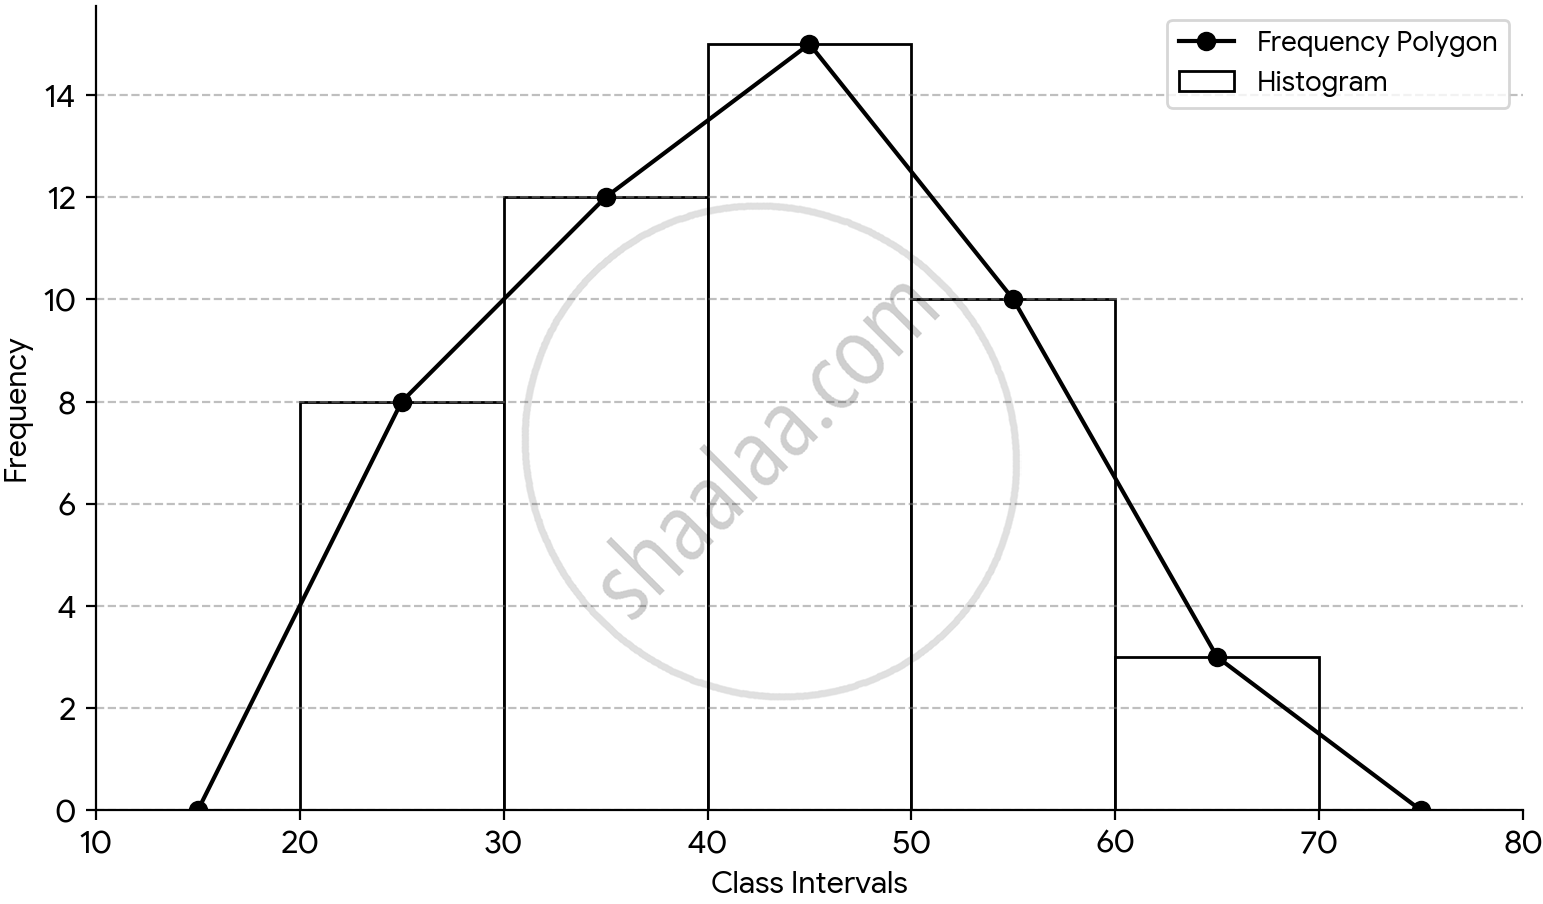
Construct a combined histogram and frequency polygon for the following frequency distribution:
| Class-intervals | 20-30 | 30-40 | 40-50 | 50-60 | 60-70 |
| Frequency | 8 | 12 | 15 | 10 | 3 |
योग
Advertisements
उत्तर
Steps to construct a combined histogram and frequency polygon is as follows:
- Draw two mutually perpendicular axes, the X-axis and Y-axis, intersecting at the origin O.
- Mark the class intervals (10-20, 20-30, ... 70-80) along the X-axis taking a suitable scale.
- Mark the corresponding frequencies (0, 2, 4, ... 16) along the Y-axis taking a suitable scale.
- Construct contiguous rectangles with bases as class intervals and heights proportional to their frequencies.
- Locate and mark the midpoints of the top horizontal sides of each rectangle drawn in the previous step [Identifying points (25, 8), (35, 12), (45, 15), (55, 10), and (65, 3)]
- Take an imagined class interval 10-20 preceding the first class and mark its midpoint at frequency 0.
- Take an imagined class interval 70-80 succeeding the last class and mark its midpoint at frequency 0.
- Join all these consecutive midpoints, including the anchor points, using straight line segments.
shaalaa.com
क्या इस प्रश्न या उत्तर में कोई त्रुटि है?
