Advertisements
Advertisements
प्रश्न
Select a meteorological observatory located in your city or near your town. Tabulate the temperature data as given in the climatological table of observatories:
- Note the altitude, latitude of the observatory and the period for which the mean is calculated.
- Define the terms related to temperature as given in the table.
- Calculate the daily mean monthly temperature.
- Draw a graph to show the daily mean maximum, the daily mean minimum and the mean temperature.
- Calculate the annual range of temperature.
- Find out in which months the daily range of temperature is the highest and the lowest.
- List out the factors that determine the temperature of the place and explain the possible causes for temperature variation in the months of January, May, July and October.
कृति
Advertisements
उत्तर
(i) Observatory Details
- Observatory: New Delhi (Safdarjung)
- Latitude: \[28^\circ 35'\text{ N}\]
- Period for Mean Calculation: \[1951 - 1980\]
- Altitude above Mean Sea Level: \[216\text{ m}\]
(ii) Definitions of Temperature Terms
- Mean of Daily Maximum: The average of the highest recorded daily temperatures for a specific month over the observation period.
- Mean of Daily Minimum: The average of the lowest recorded daily temperatures for a specific month over the observation period.
- Daily Mean Monthly Temperature: The average temperature of a day, calculated by taking the sum of the mean daily maximum and mean daily minimum divided by two.
- Annual Range of Temperature: The numerical difference between the mean temperature of the warmest month and the coldest month.
(iii) Calculation of Daily Mean Monthly Temperature
- January:
\[\frac{21.1^\circ\text{C} + 7.3^\circ\text{C}}{2} = 14.2^\circ\text{C}\] - May:
\[\frac{39.6^\circ\text{C} + 25.9^\circ\text{C}}{2} = 32.75^\circ\text{C}\]
(iv) Graphical Representation
Instructions for Graph:
- Take the X-axis for months (January through December) and the Y-axis for temperature in \[^\circ\text{C}\].
- Plot three distinct curves or lines representing:
- Daily mean maximum temperature.
- Daily mean minimum temperature.
- Overall daily mean temperature.
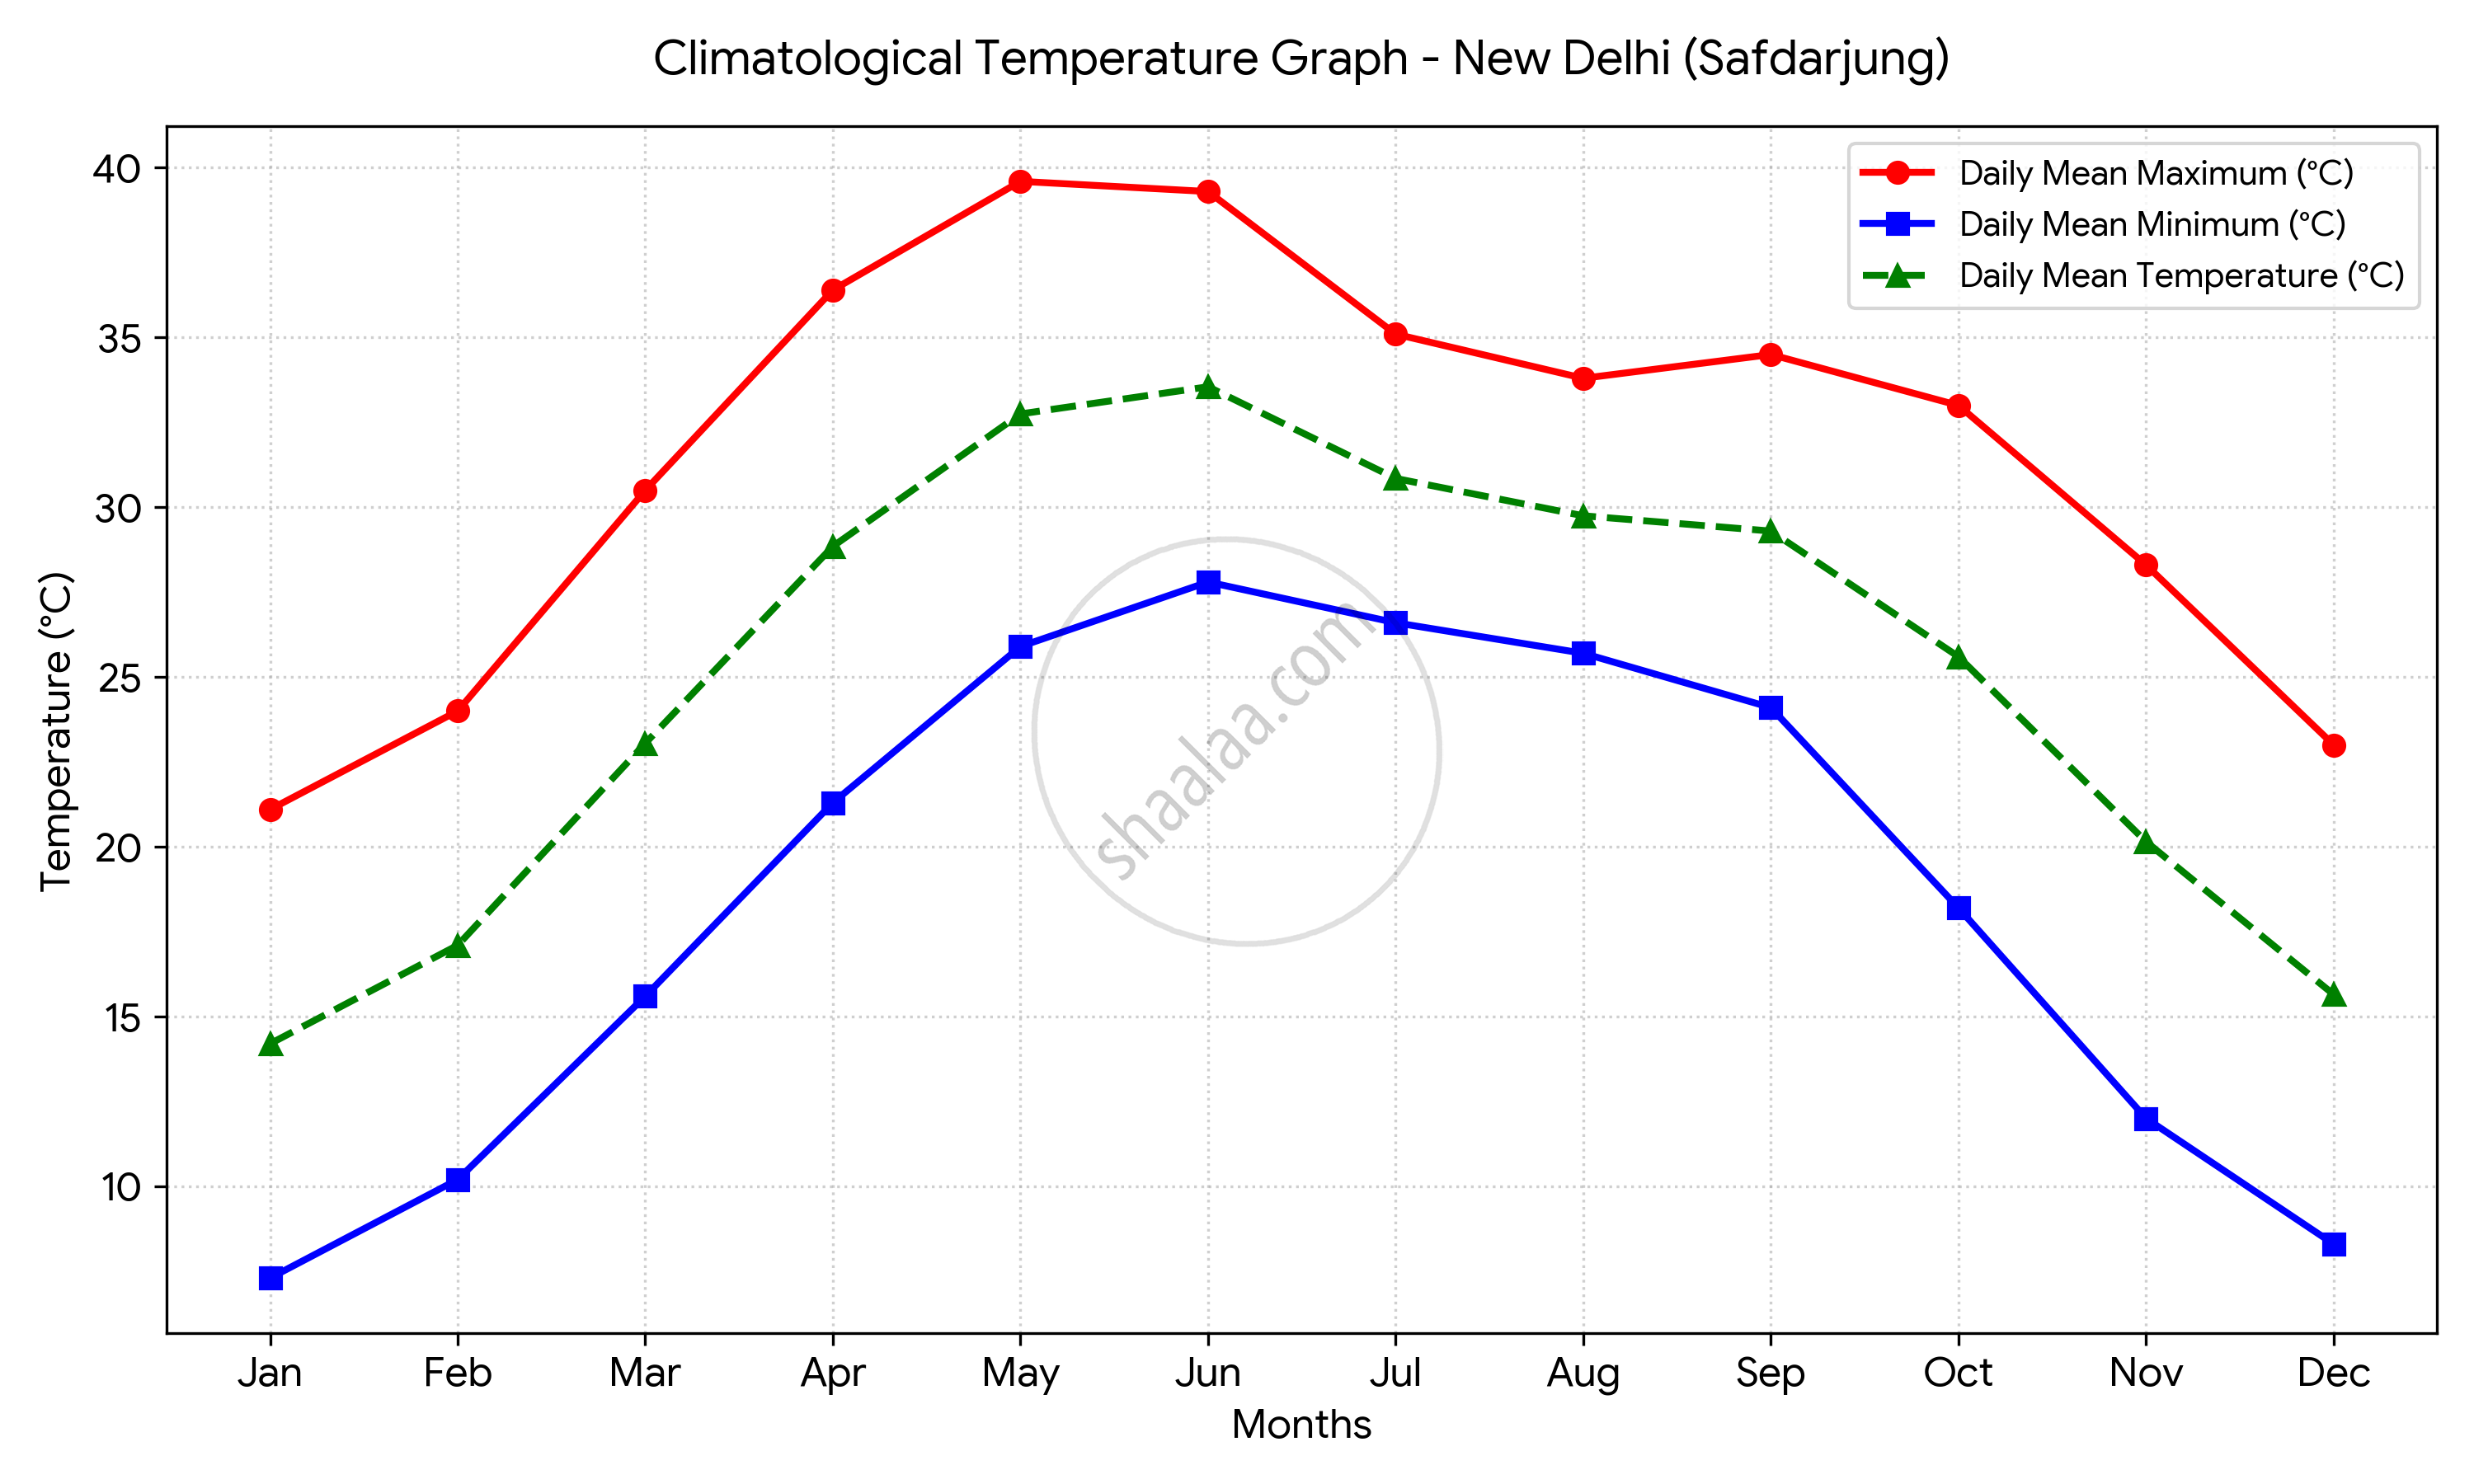
- Red Line (Daily Mean Maximum): Peaks in May and June (\[39.6^\circ\text{C}\] to \[39.3^\circ\text{C}\]), reflecting peak summer intensity.
- Blue Line (Daily Mean Minimum): Drops to its lowest in January (\[7.3^\circ\text{C}\]), representing the coldest winter conditions.
- Green Dashed Line (Overall Mean Temperature): Shows the smooth seasonal transition between winter cooling and summer warming, staying moderated during the monsoon months due to cloud cover.
(v) Calculation of Annual Range of Temperature
- \[\text{Annual Range} = \text{Mean Temperature of May} - \text{Mean Temperature of January}\]
- \[\text{Annual Range} = 32.75^\circ\text{C} - 14.2^\circ\text{C} = 18.55^\circ\text{C}\]
(vi) Highest and Lowest Daily Range of Temperature
- Highest Daily Range: Occurs during the dry spring/summer transition months (such as April and May), characterized by intense daytime insolation and rapid cooling at night under clear skies.
- Lowest Daily Range: Occurs during the monsoon season (such as July and August), when thick cloud cover blocks direct solar radiation during the day and traps terrestrial radiation at night, keeping diurnal temperature fluctuations minimal.
(vii) Factors Determining Temperature & Seasonal Variations
- Key Factors: Latitude, altitude, distance from the sea, air mass circulation, and cloud cover.
- January Variation: Low temperatures due to the winter season in the Northern Hemisphere when the sun's rays fall obliquely.
- May Variation: Peak summer temperatures driven by the northward migration of the sun (vertical sun rays overhead) and intense continental heating.
- July Variation: Moderated high temperatures accompanied by high humidity due to the onset and active phase of the Southwest Monsoon.
- October Variation: A transitional post-monsoon period where temperatures begin to drop moderately as the sun shifts southward, bringing clear skies and pleasant weather.
shaalaa.com
क्या इस प्रश्न या उत्तर में कोई त्रुटि है?
अध्याय 8: Solar Radiation, Heat Balance and Temperature - Exercises [पृष्ठ ७४]
