Advertisements
Advertisements
प्रश्न
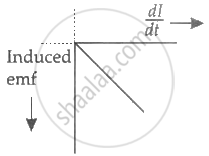
Plot a graph showing variation of induced e.m.f. with the rate of change of current flowing through a coil.
आलेख
Advertisements
उत्तर
e = `-L (dl)/dt`
shaalaa.com
क्या इस प्रश्न या उत्तर में कोई त्रुटि है?
Plot a graph showing variation of induced e.m.f. with the rate of change of current flowing through a coil.
e = `-L (dl)/dt`
