Advertisements
Advertisements
प्रश्न
In the physics laboratory, various blocks of materials labelled A and B, each with masses ranging from 10 grams to 50 grams, are utilised to determine their respective heat capacities. Subsequently, a graph is plotted to depict the relationship between the heat capacity and the mass of the materials, as shown.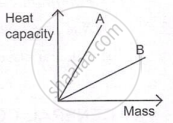
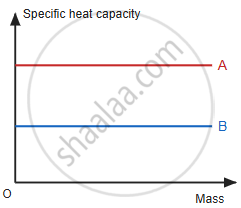
- Plot a graph illustrating the relationship between the mass and specific heat capacity of materials A and B.
- Which material is a relatively better conductor?
Advertisements
उत्तर
(a) Heat capacity (C') = m × c
\[ \therefore c = \frac{\mathrm{C}'}{m} \]
So the slope of the heat capacity–mass graph gives the specific heat capacity. Both graphs are straight lines through the origin, so each material's specific heat capacity stays constant and does not depend on mass. The graph between specific heat capacity and mass is therefore a straight line parallel to the mass axis for both A and B.
Graph A is steeper than graph B, so the specific heat capacity of A is greater than that of B. The line for A lies above the line for B.
(b) Material B is a relatively better conductor because it has a lower specific heat capacity. It needs less heat to raise its temperature, so it heats up and conducts heat faster.
