Advertisements
Advertisements
प्रश्न
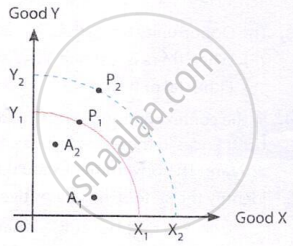
In the given figure X1Y1 and X2Y2 are Production Possibility Curves in two different time periods T1 and T2 respectively. A1 and A2 represent actual outputs in T1 and T2 periods respectively. P1 and P₂ are potential outputs in T1 and T2 periods respectively. The change in potential production over the two periods would be represented by a shift from ______.
(Choose the correct alternative).
विकल्प
P2 to A2
A1 to A2
A2 to A1
P1 to P2
Advertisements
उत्तर
In the given figure X1Y1 and X2Y2 are Production Possibility Curves in two different time periods T1 and T2 respectively. A1 and A2 represent actual outputs in T1 and T2 periods respectively. P1 and P₂ are potential outputs in T1 and T2 periods respectively. The change in potential production over the two periods would be represented by a shift from P1 to P2.
Explanation:
Potential production changes from potential output in period T1 to potential output in period T2, i.e. from P1 to P2.
