Advertisements
Advertisements
प्रश्न
Fill in the blanks:
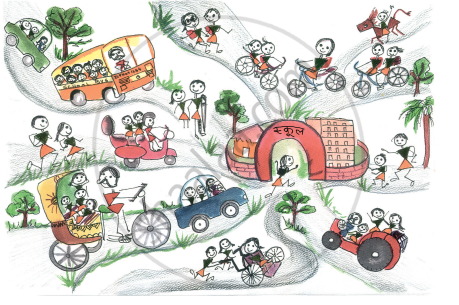
The least number of students come to school by ______.
विकल्प
Tractor
Bus
Car
Horse/wheel chair
Advertisements
उत्तर
The least number of students come to school by horse/wheel chair.
APPEARS IN
संबंधित प्रश्न
Watching TV/listening to the radio…
- ______ children spend more than 6 hours in a week.
- ______ children spend no time at all.
- Most children spend ______ hours in a week.
- ______ children spend more than 3 hours.
Find out from 20 friends the programmes they like and dislike, and write in a table.
| Kind of programme |
Number of children liking it |
Number of children disliking it |
| News | ||
| Serials | ||
| Cartoons | ||
| Comedy shows | ||
| Sports |
- Which kind of programme is liked by most children?
- Which kind of programme is disliked by the least number of children?
- How many children like sports programmes?
- Is there any kind of programme not liked by anyone? Yes/No. If yes, which one?
Look at the traffic scene in the picture and fill in the table.
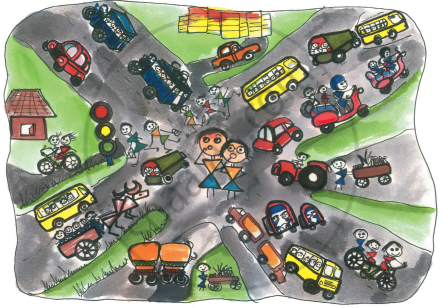
| Way of Travel | How many |
| Walking (people) | |
| Bicycles | |
| Scooters | |
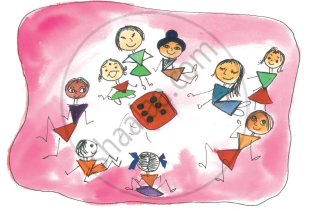
How many dots are there on the different faces of a die?
Rabia threw her die 30 times. She got  five times. In her table she marked:
Now fill in the table:
| Face of the die | Number of times ( / for each throw) |
 |
|
 |
|
 |
|
 |
|
 |
|
 |
| Favourite sweet | Number of people |
| Jalebi | 20 |
| Rasgulla | 18 |
| Jamun | 25 |
| Laddoo | 22 |
| Burfi | 17 |
| Kalakand | 15 |
| Food item | Number of students |
| Lemon rice | 7 |
| Meals | 12 |
| Curd rice | 5 |
| Fried rice | 3 |
| Tomato rice | 2 |
Food item brought by the smallest number of students ______
|
Attendance Board Date 8/2/2007 |
|||
| Class | Number of Students | Students Present | Students absent |
| Class I | 27 | 25 | 2 |
| Class II | 23 | 22 | 1 |
| Class III | 24 | 21 | 3 |
| Class IV | 22 | 18 | 4 |
| Class V | 25 | 23 | 2 |
| Total | |||
This board shows the number of students in each class. It also shows the number of students present and absent.
How many children in all are there in the school?
Rohan, Jacob and Geeta also measured their hands. They stuck their strips as shown.
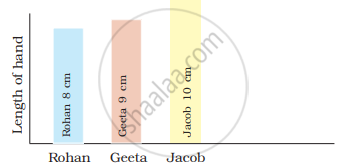
Look at the picture and fill in the blanks:
The length of Jacob's hand is ______ than Geeta's hand.
| Bird | Sparrow | Crow | Parrot | Peacock | Hen |
| Colours | 2 | 1 | 2 | 10 | 4 |
Which bird has the most colours?
